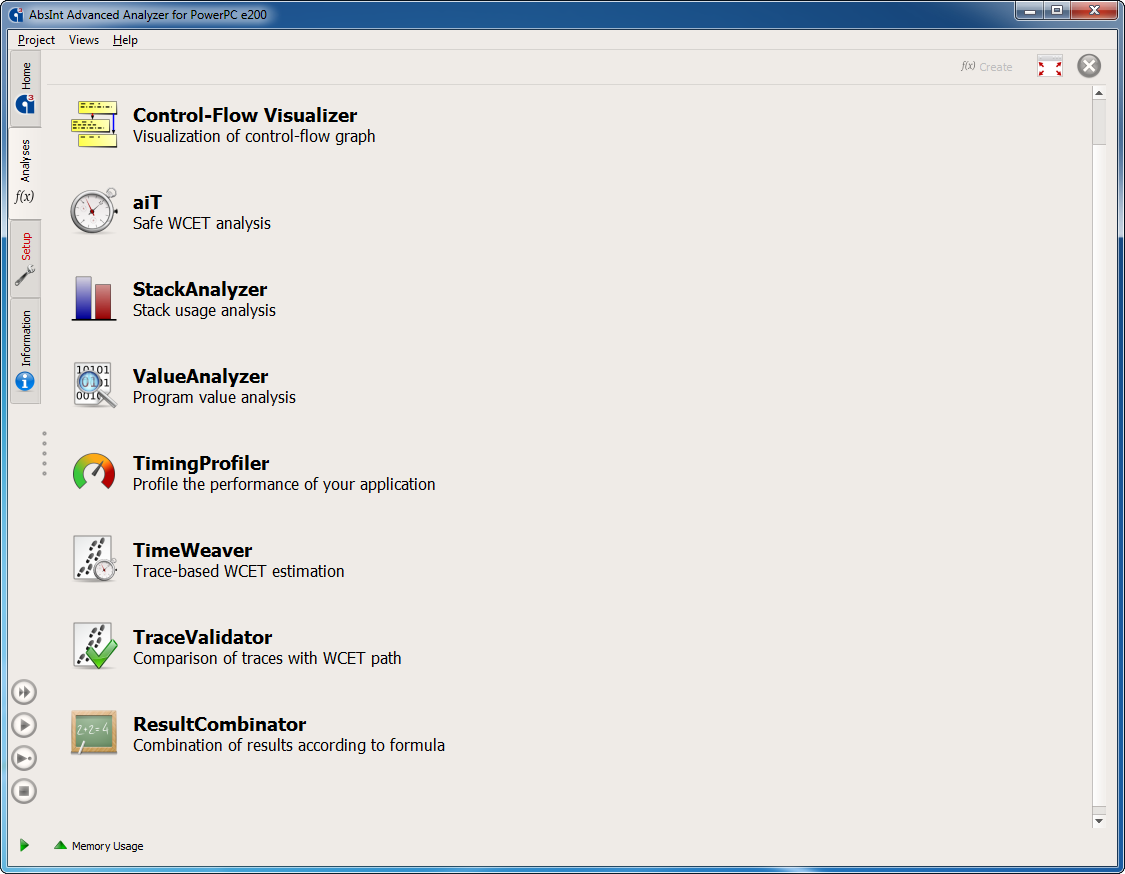
aiT can be combined with other analyzers from AbsInt in a single intuitive user interface.
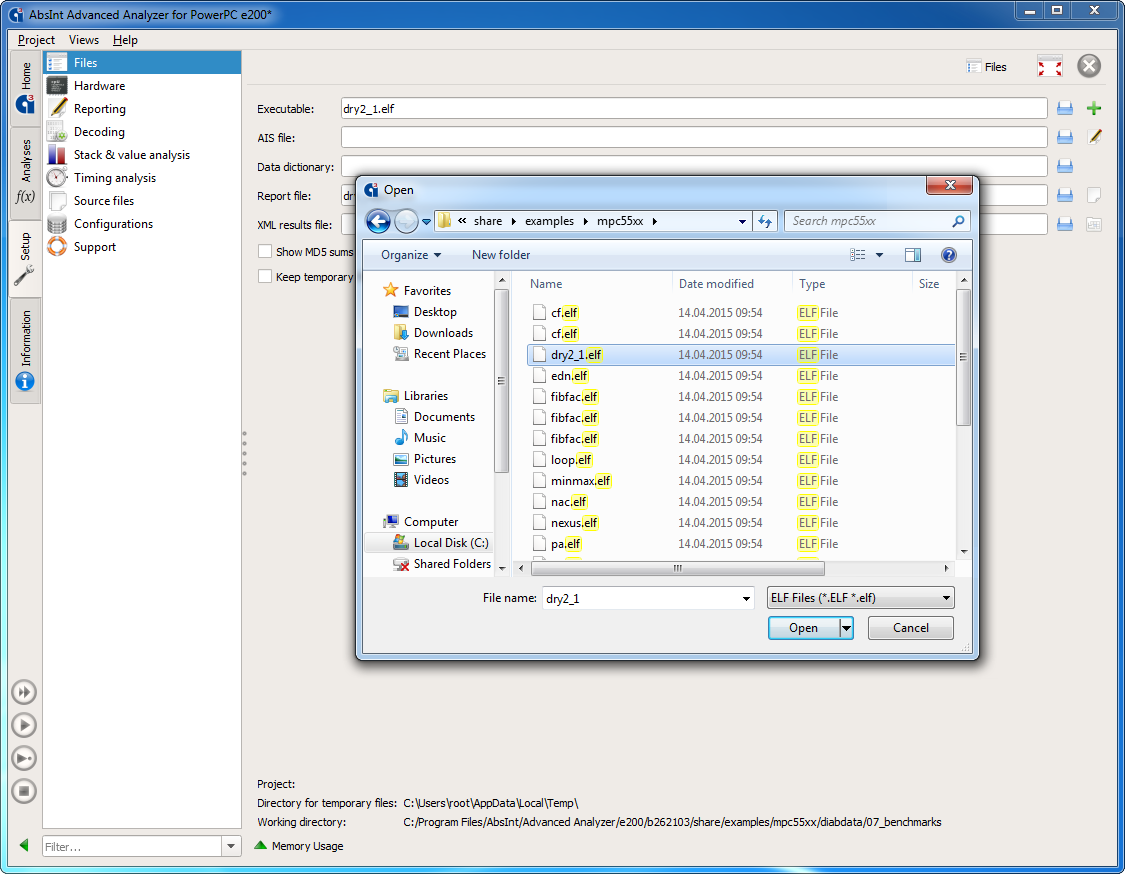
aiT directly analyzes binary executables, so that no modification of your toolchain or the system’s operational behavior or performance is required.
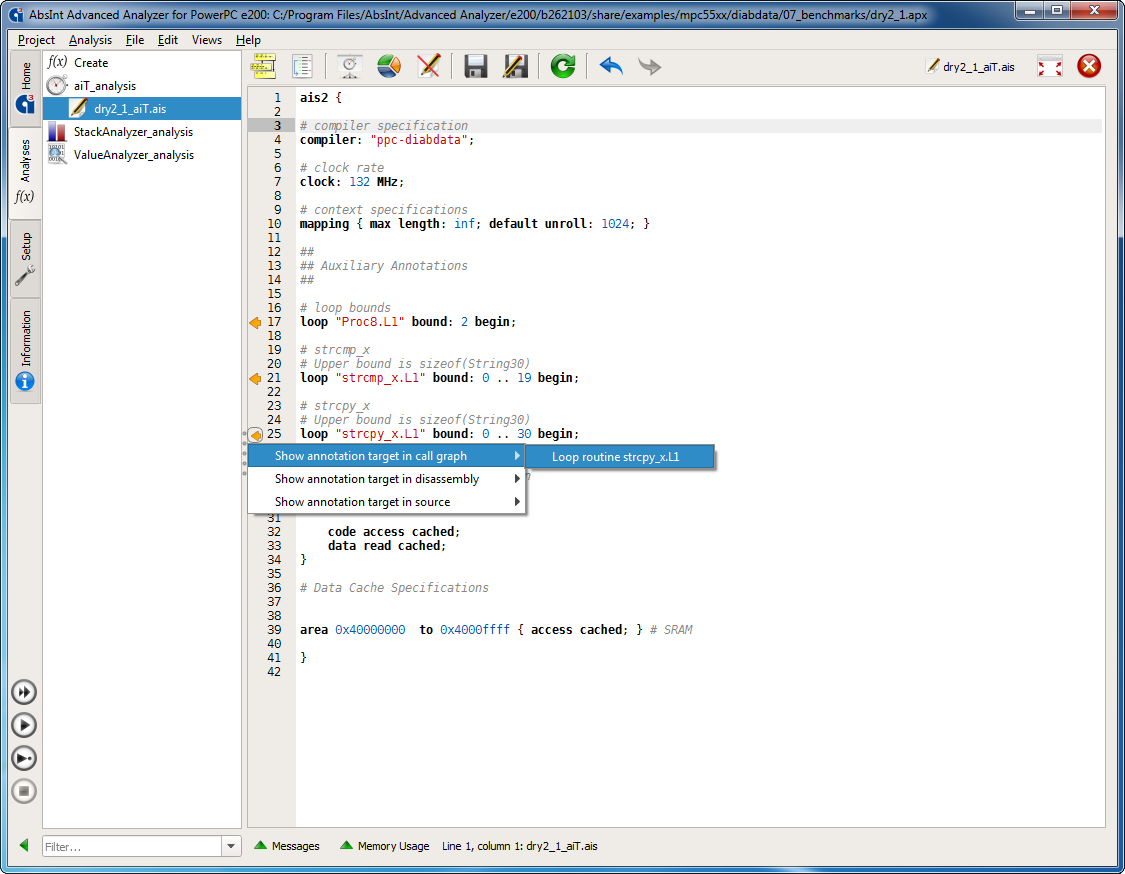
aiT accepts optional user annotations for the analyzed files, such as targets of indirect function calls, upper bounds for loop iteration counts, recursion depth, code snippets that should not be analyzed, infeasible code, and so on. You can provide the annotations in a separate text file, or simply use the fully integrated annotations wizard that will generate such a file automatically based on your input.
Annotations are only required if the information cannot be detected automatically by aiT, e.g. for dynamic program properties. The amount of required annotations is dramatically reduced by a number of advanced techniques such as automatic loop-bound and array-call recognition.
Point-and-click annotations
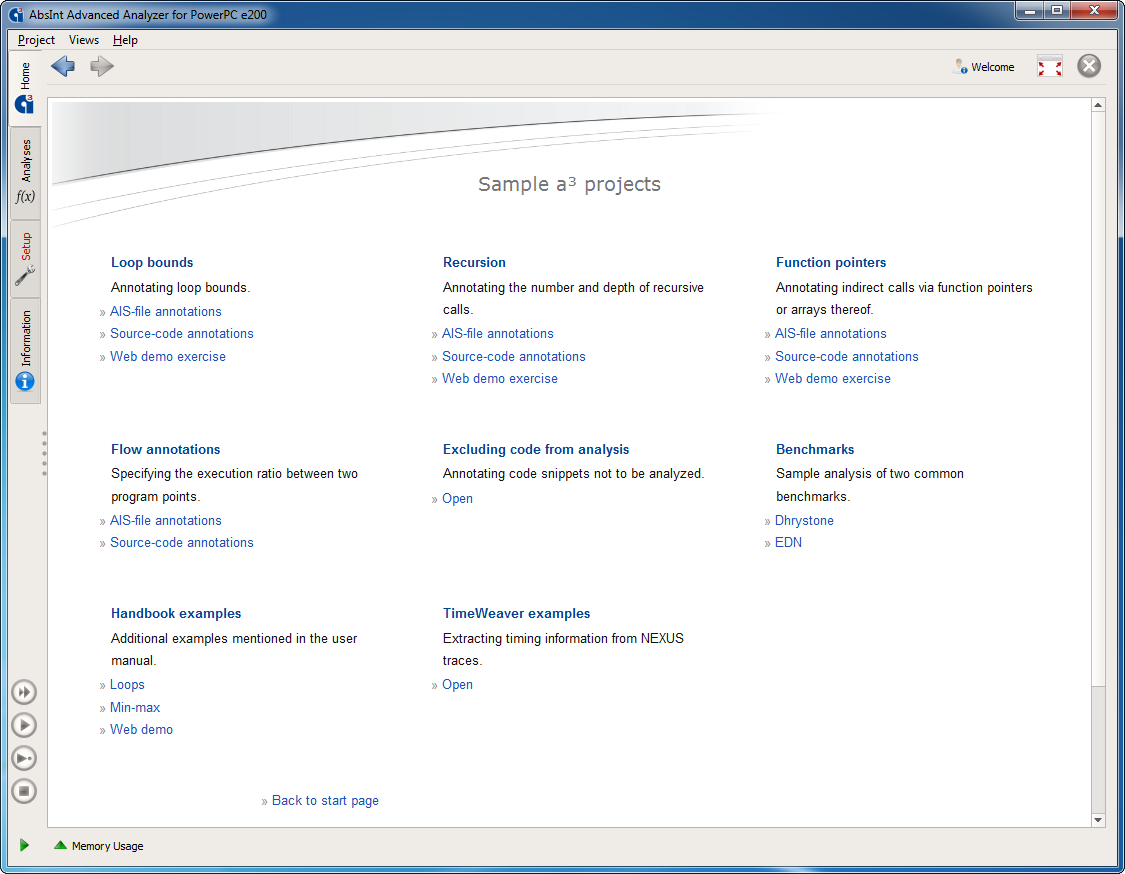
Examples showcasing various annotations
“aiT is very easy and straightforward to use. While it does provide a lot of configuration options, one can get to a first WCET computation result very quickly. Advanced configuration through annotations can be added later. [… It also] has by a wide margin the best capabilities to resolve dynamic calls automatically.”Independent study by University of Stuttgart (PDF)
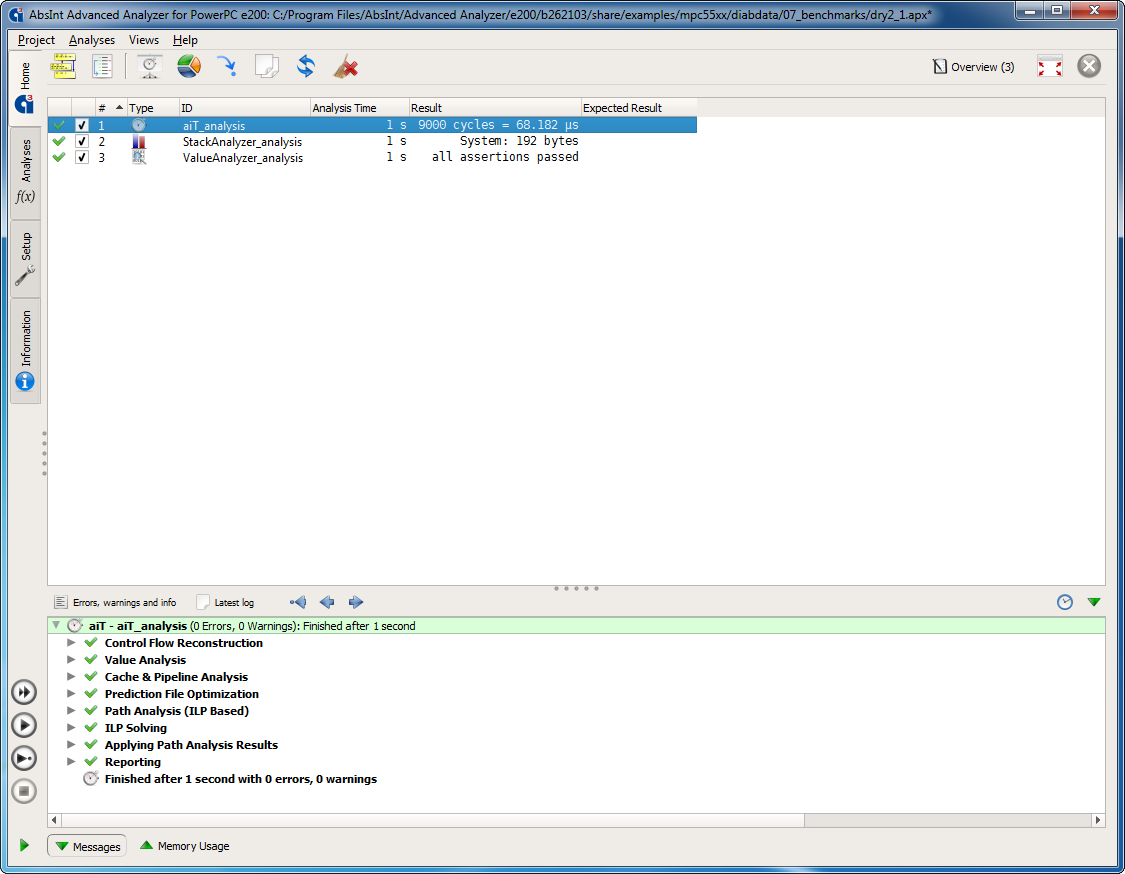
Analysis results: the computed WCET is given in CPU cycles and microseconds. aiT-computed bounds are valid for all inputs and execution scenarios.
Double-clicking on the analysis results opens the call graph of the analyzed application.
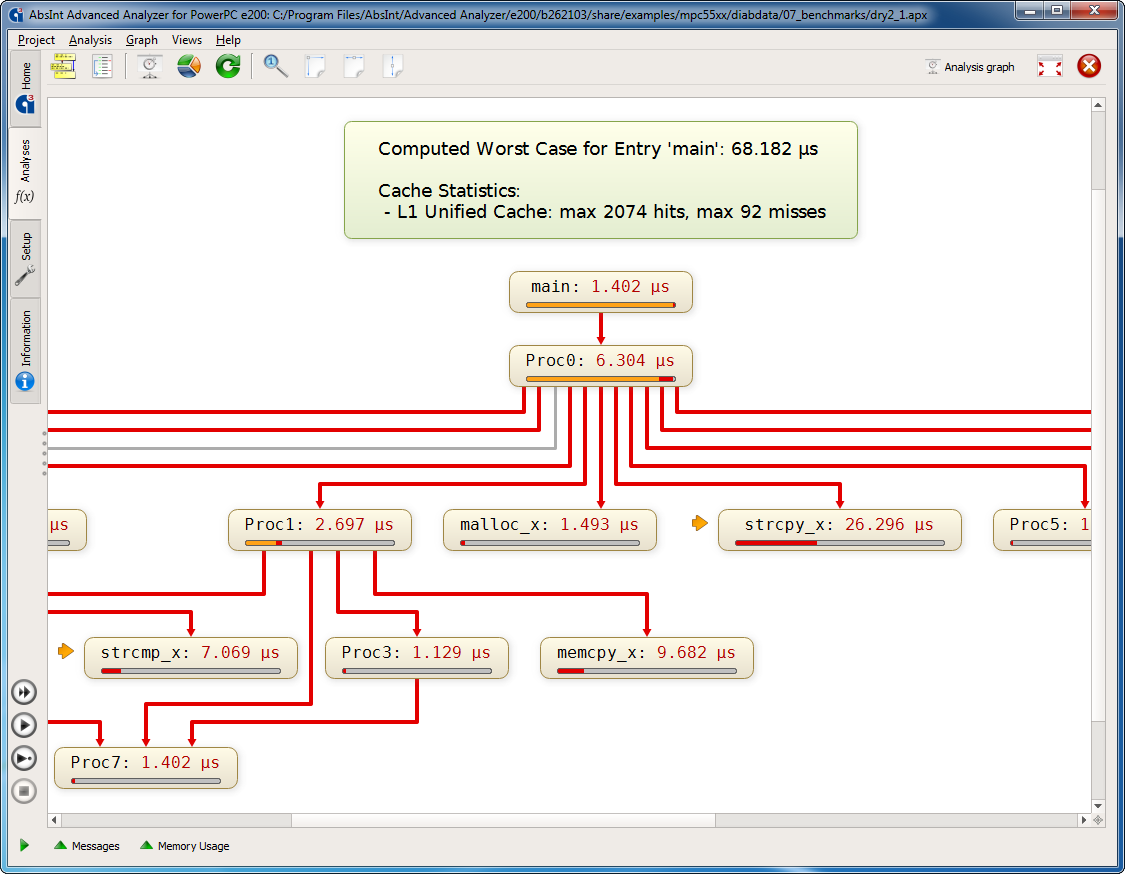
Call graph with WCET analysis results. Each routine is annotated by its relative contribution to the overall WCET. Worst-case execution paths, infeasible calls, and recursions are automatically recognized and highlighted.
aiT also automatically determines any locations that could benefit from additional annotations, marks them for you, and even suggests the best wording for the annotation that you can then accept or modify with a couple clicks.
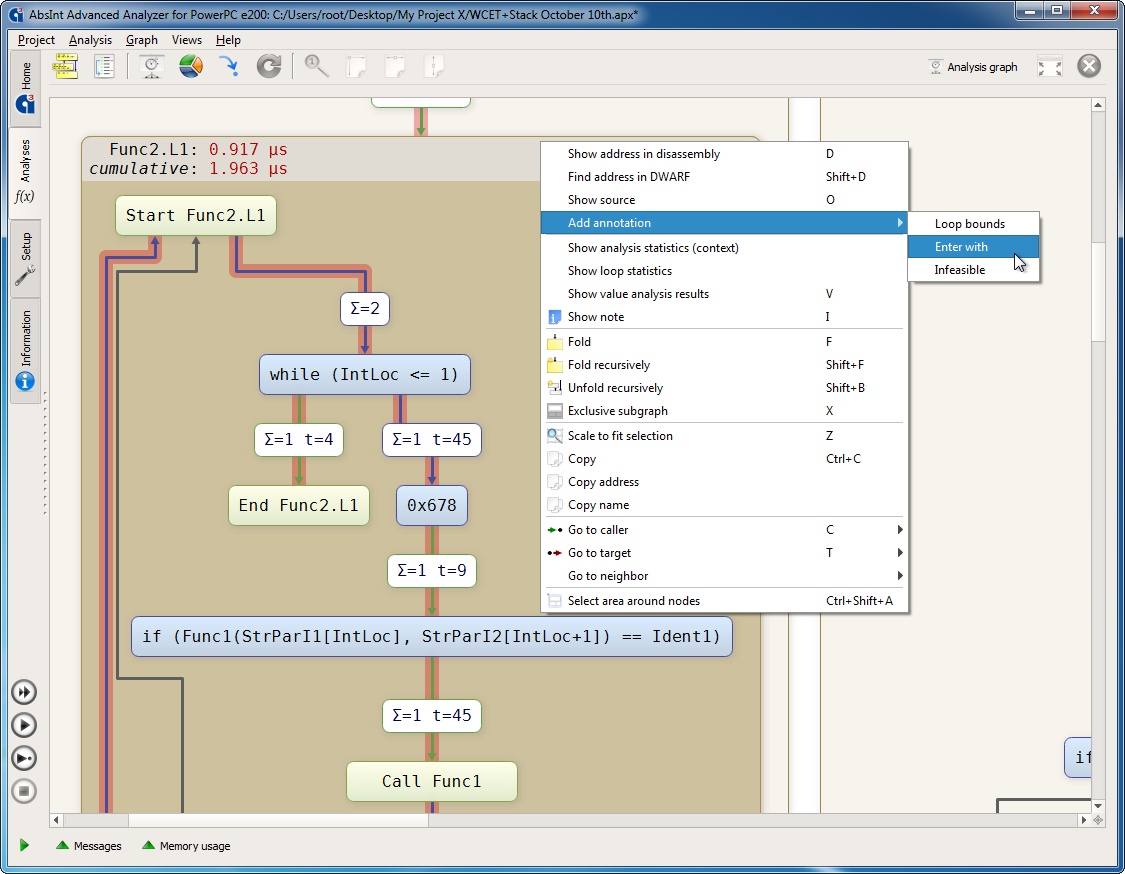
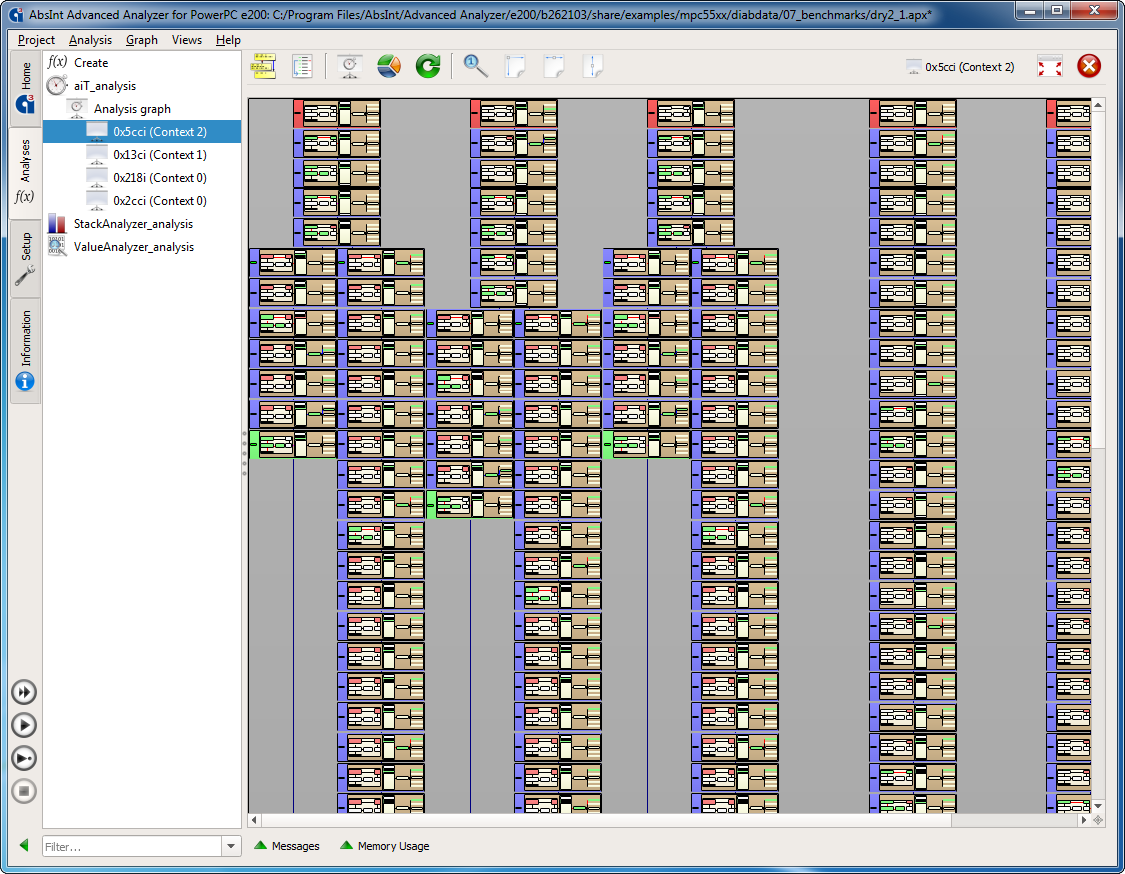
The routines can be interactively unfolded to inspect the control flow within them.
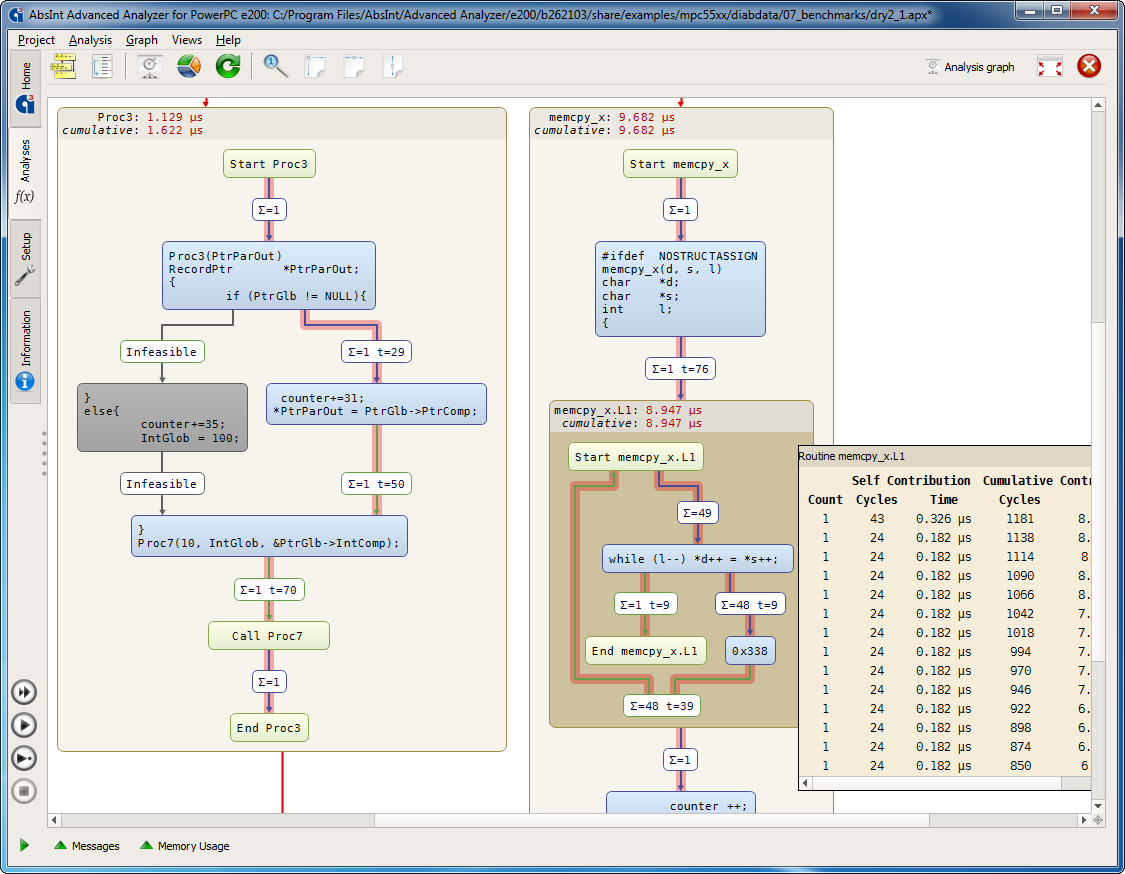
Control flow graph with WCET analysis results. Each edge is labeled with the maximum number of traversals in the worst case and the execution time of the basic block it originates from. Infeasible parts of the analyzed program (dead code) are grayed out.
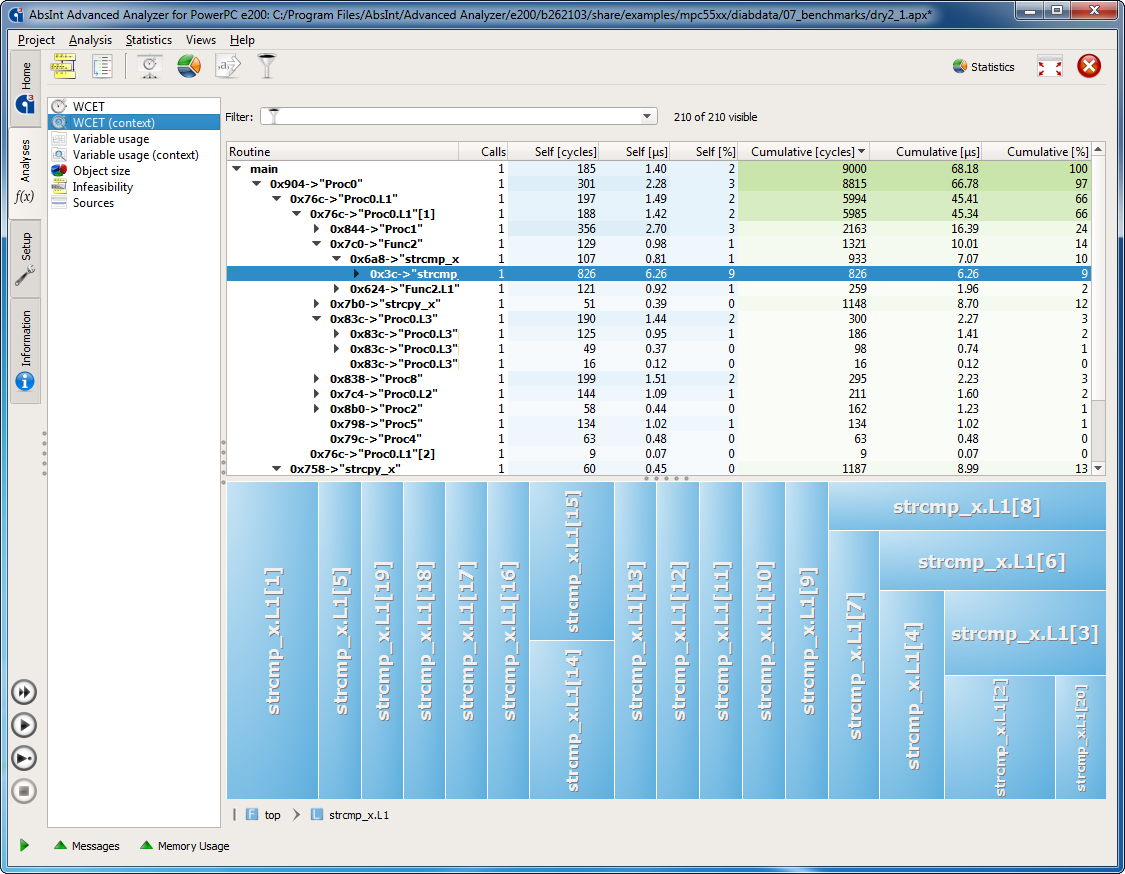
Analysis details such as WCET contribution in different contexts can be viewed in additional information windows. Context menus enable jumping from anywhere in the graph to the corresponding line in the C or assembly code.
Just like at the call-graph level, any locations that could benefit from additional annotations are automatically marked, and the best wording is automatically suggested, so you can accept or modify it with just a few clicks.
For each instruction, the set of all possible pipeline states can be inspected as desired.
“A clear winner in terms of additional functionality is AbsInt, which provides tools like a syntax-aware editor for annotations including a wizard for easily adding annotation lines, and an interactive callgraph viewer. The other tools have static output which may be viewed, but cannot be interacted upon.”Independent study by University of Stuttgart (PDF)
Visualization of pipeline and cache behavior over time. Each horizontal layer corresponds to one CPU cycle. Branches in the tree represent different execution scenarios, e.g. a cache hit and a cache miss at a memory access if both cases have to be analyzed. aiT automatically checks all possibilities.
Sample pipeline analysis results legend (MPC5xx)
- Start state*
- Intermediate state*
- End state*
- State description
- Flash A
- Flash B
- Memory controller
- L2U
- Fetch
- Dispatch
- Execute
- Write-back
- Decode buffer
- Prefetch queue
- History queue
* Relative to the instruction to be analyzed.
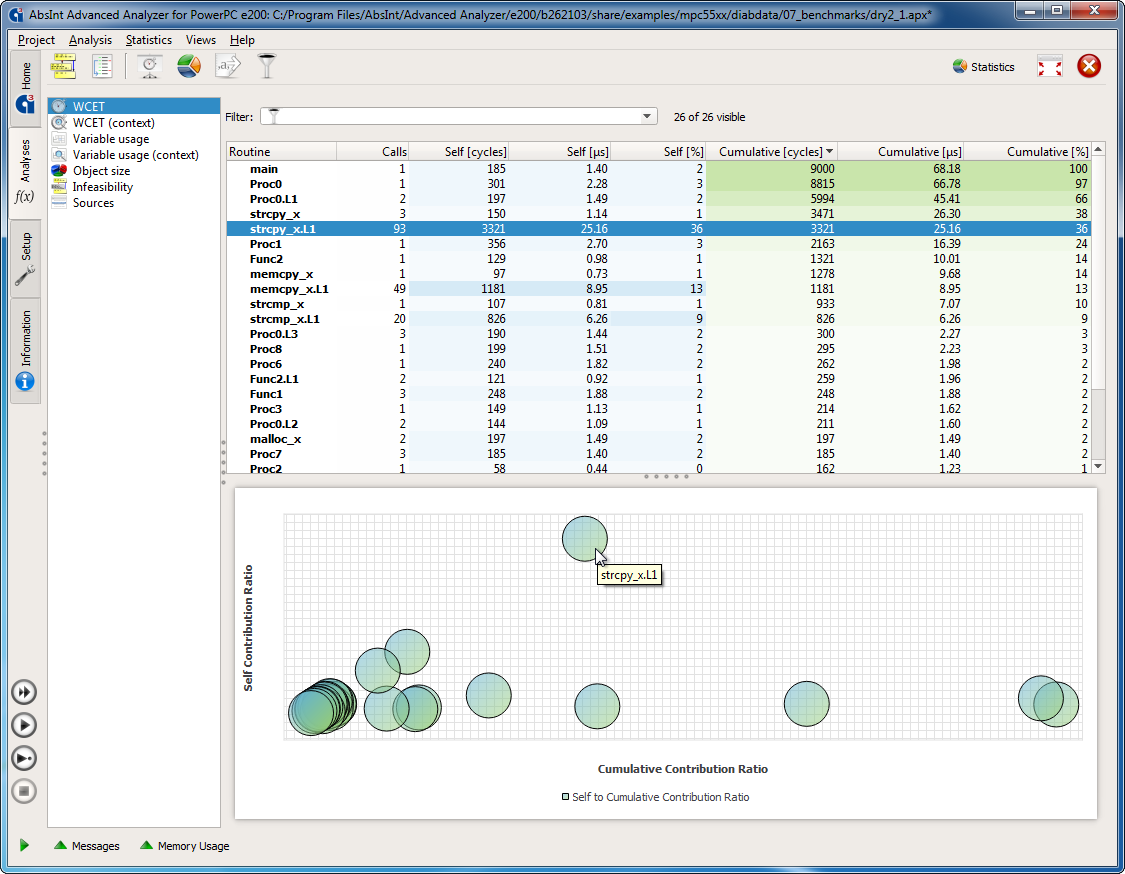
Various statistics are compiled so you can quickly identify bottlenecks and easily explore any areas of interest.
Interactive visualization of WCET contributions
per execution context
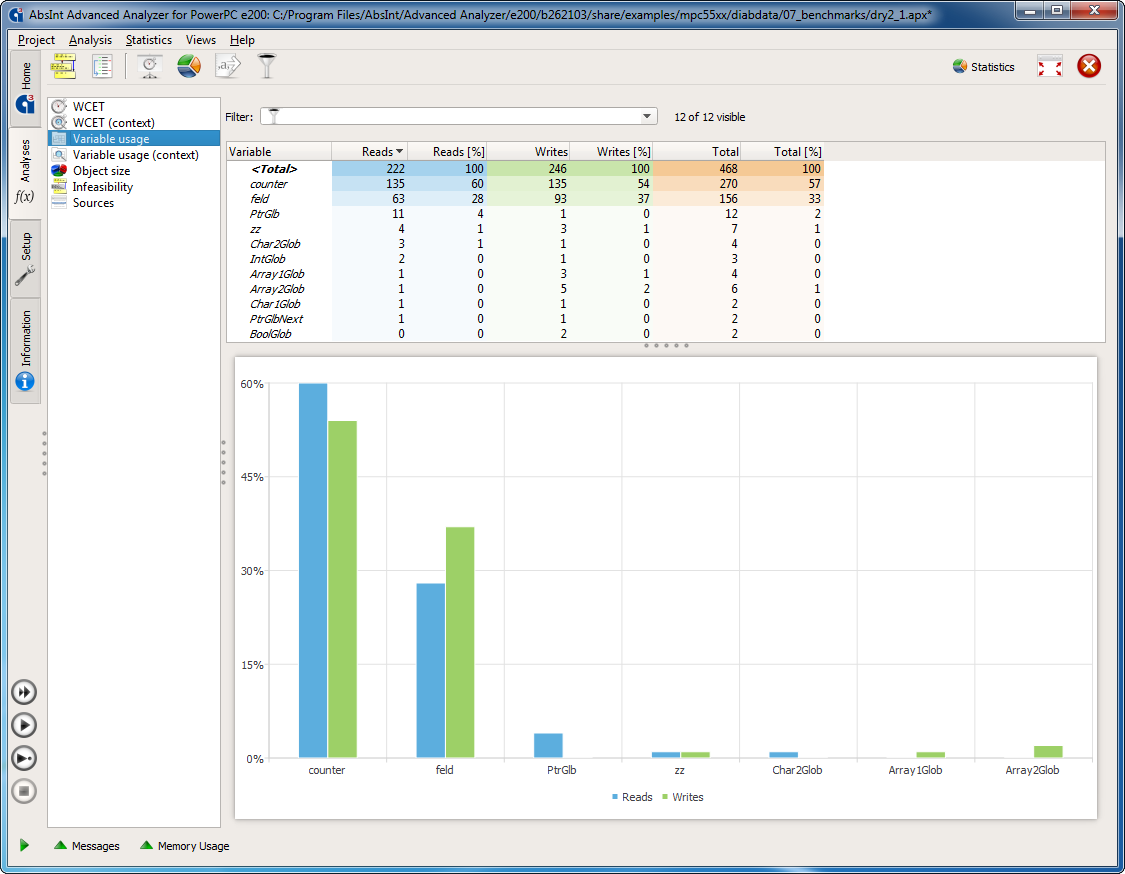
Variable usage statistics
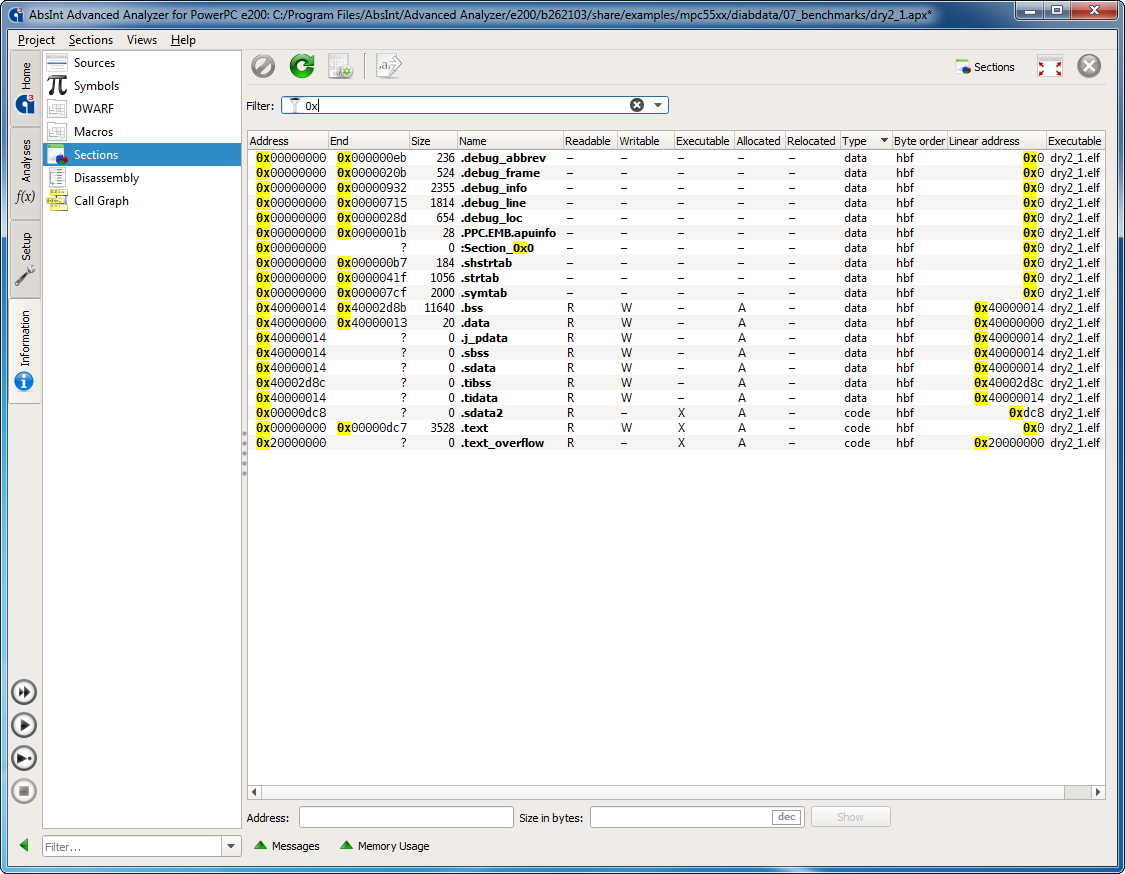
The Sections view allows you to view all sections of the binary and inspect their content like in a hex editor. It also enables you to find out the memory content for a given address area.
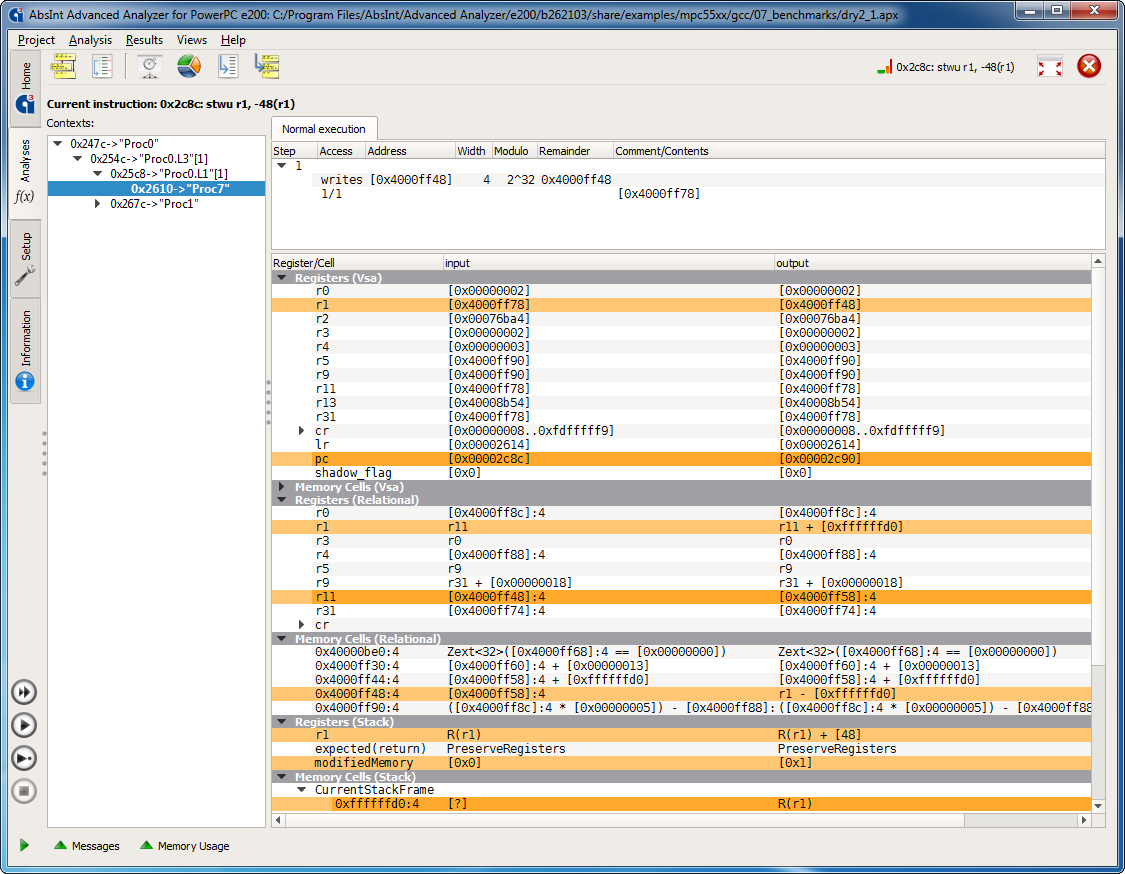
An optional ValueAnalyzer add-on lets you inspect the contents of all registers and memory cells at any program point in any execution context. It can also collect initialization data for global variables and feed it as auto-generated annotations to your WCET analysis.
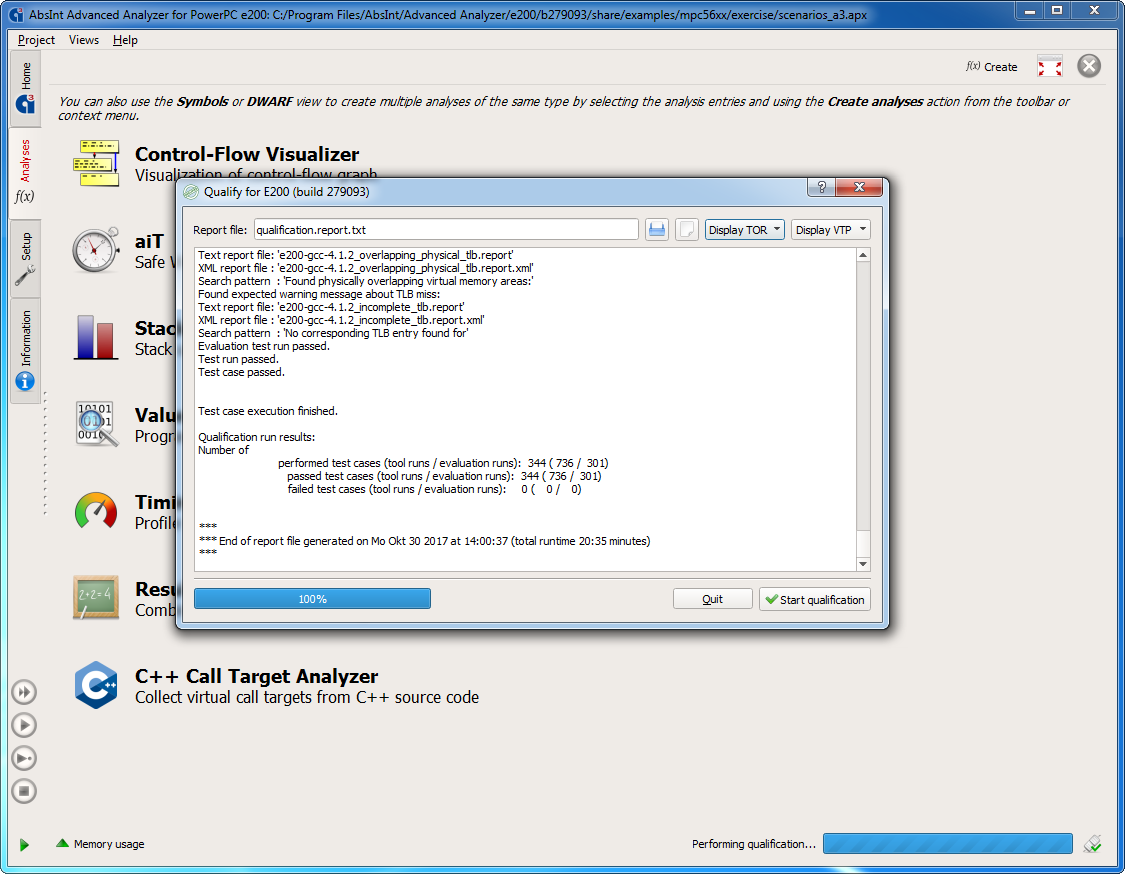
Your usage of aiT can be qualified according to ISO 26262, DO-178B/C, IEC-61508, and other safety standards. Special Qualification Support Kits can be started directly from within aiT to simplify and automate the qualification process.