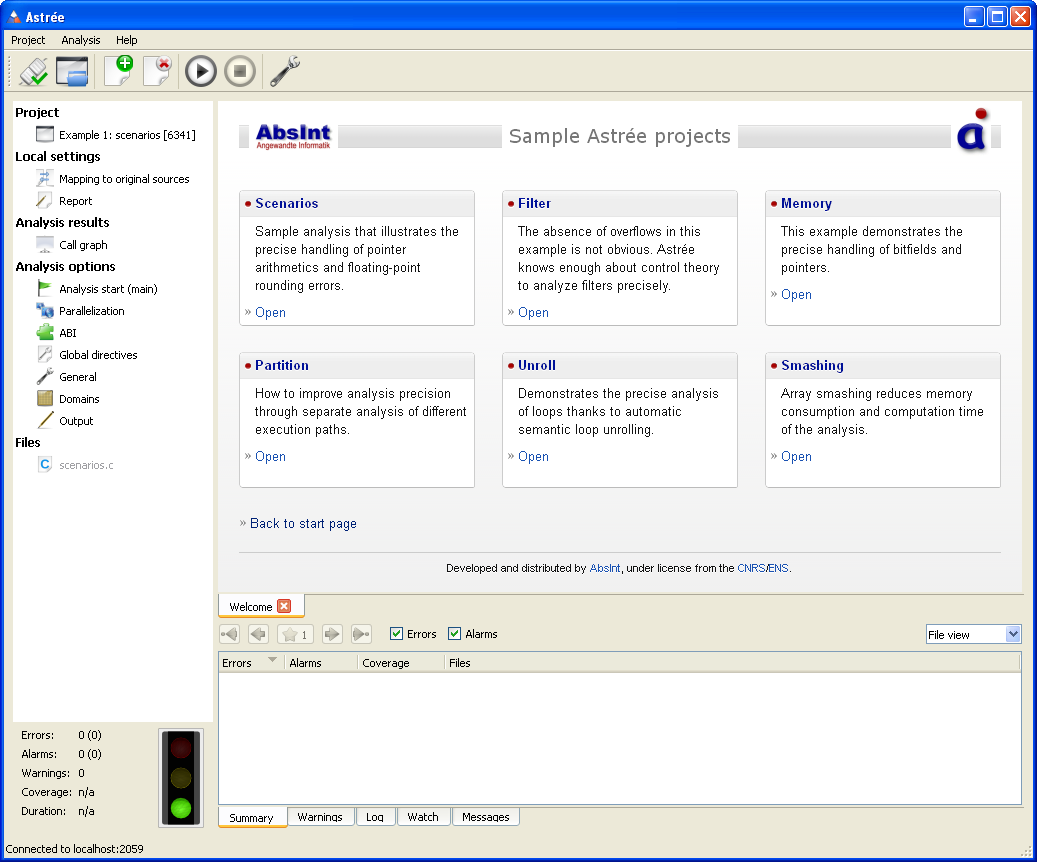
Real-life examples
Astrée comes with several real-life examples that demonstrate different analysis features and help you get started quickly.
Improved GUI
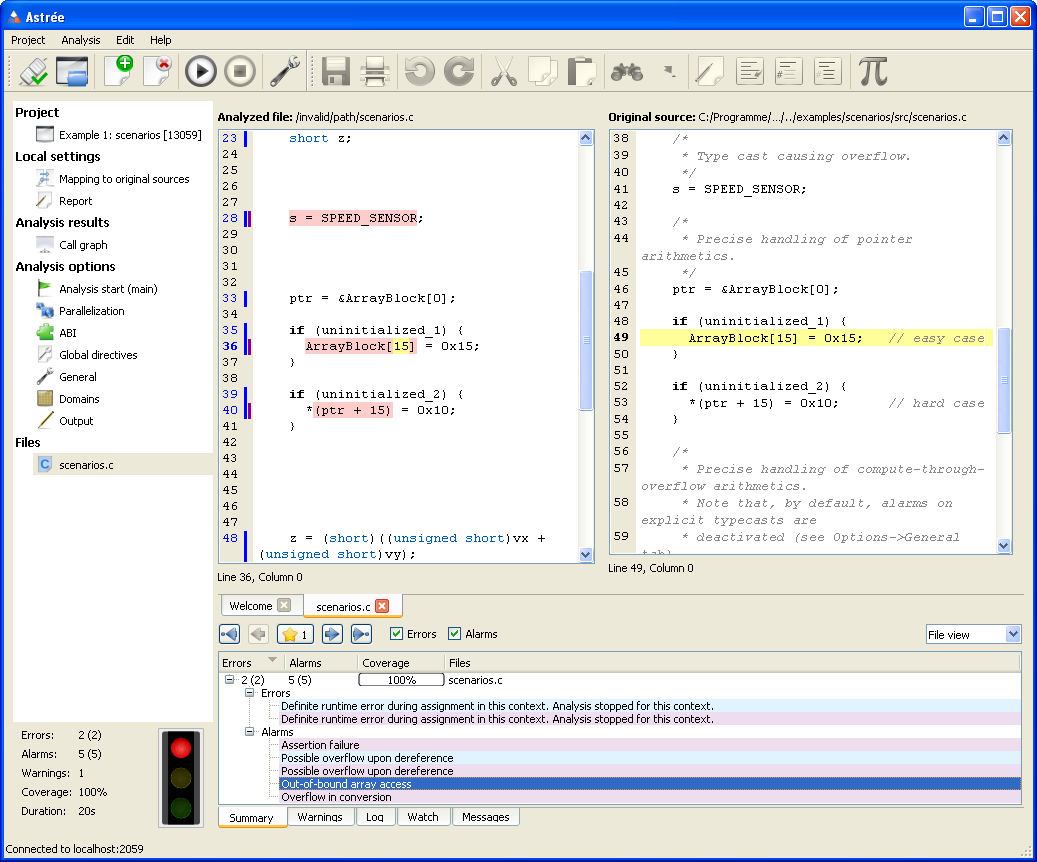
- The left-hand menu has been cleaned up for consistent appearance and better usability. The items “Errors”, “Alarms”, and “Warnings” have been merged into the lower “Output” area.
- An all-new status area in the bottom left corner offers the most important analysis stats at a glance. A traffic light enables a quick assessment of the analysis results.
- The “Summary” window now allows viewing alarms, errors, and coverage statistics per file, as well as alarms and errors grouped by categories. See screenshot.
- The new “Warnings” window collects all warning messages.
- The new “Messages” window allows viewing and navigating all analyzer messages for a code location that has been selected in the editor view.
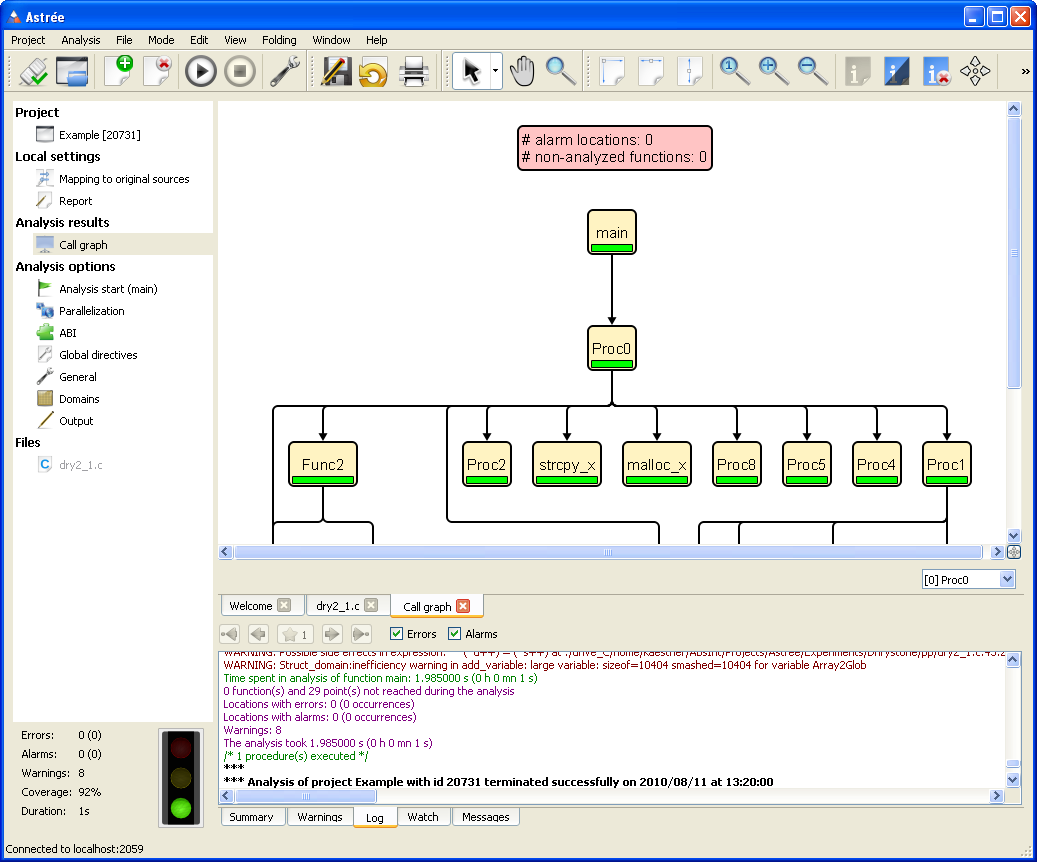
Call graph visualization
The call graph of the analyzed application can now be viewed using the seamlessly integrated, award-winning aiSee graph viewer. The graph comprises statistical information about the distribution of alarms, and can be used for navigating the sources.
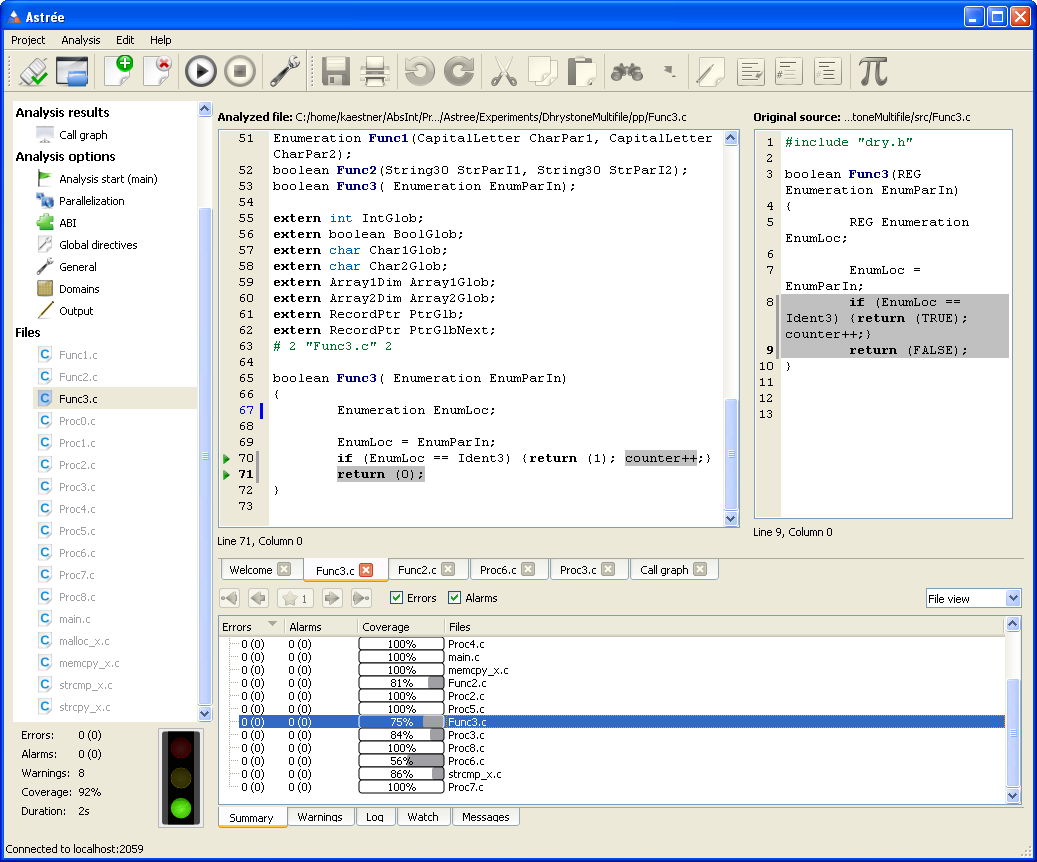
Non-analyzed code
Code that has not been analyzed is always colored automatically in the editor.
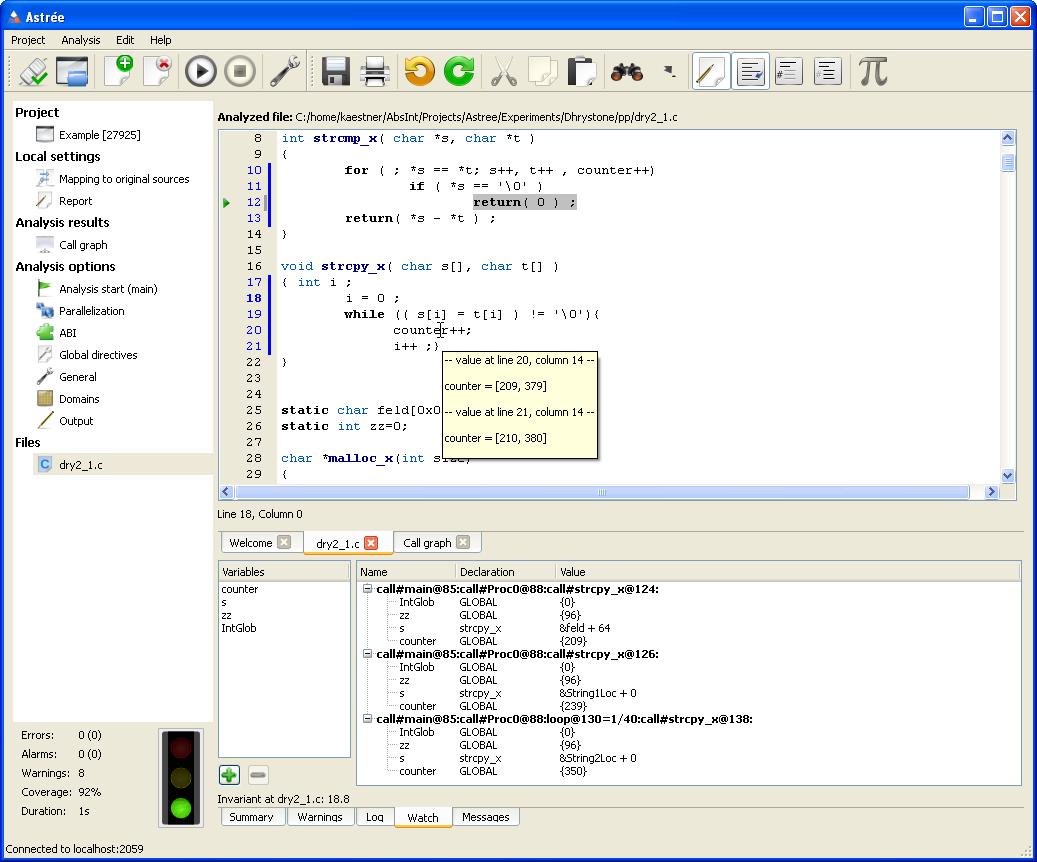
Improved “Watch” window
Astrée now exports invariants at the end points of blocks and functions. The exported invariants can be displayed in the “Watch” window, and are now also displayed as tooltips in the editor.
The sorting of loop contexts in the “Watch” window has been improved. The contexts are now sorted in the order of loop iterations.
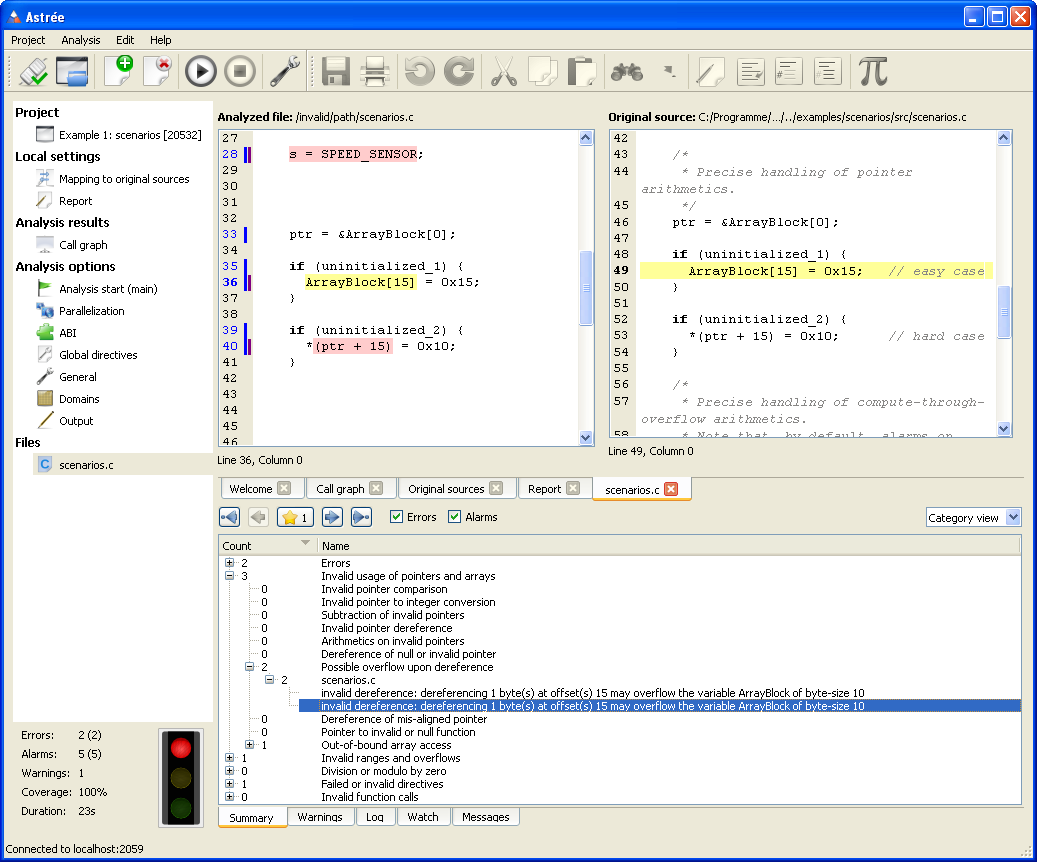
Extended “Summary” window
The “Summary” window now allows viewing alarms, errors, and coverage statistics per file, as well as alarms and errors grouped by categories. Double-clicking on a particular error takes you to the corresponding line in the source file.