StackAnalyzer is a tool for static analysis of safety-critical software. It automatically determines the worst-case stack usage of the tasks in your application and lets you find any stack overflows, or formally prove the absence thereof.
 Qualification run results
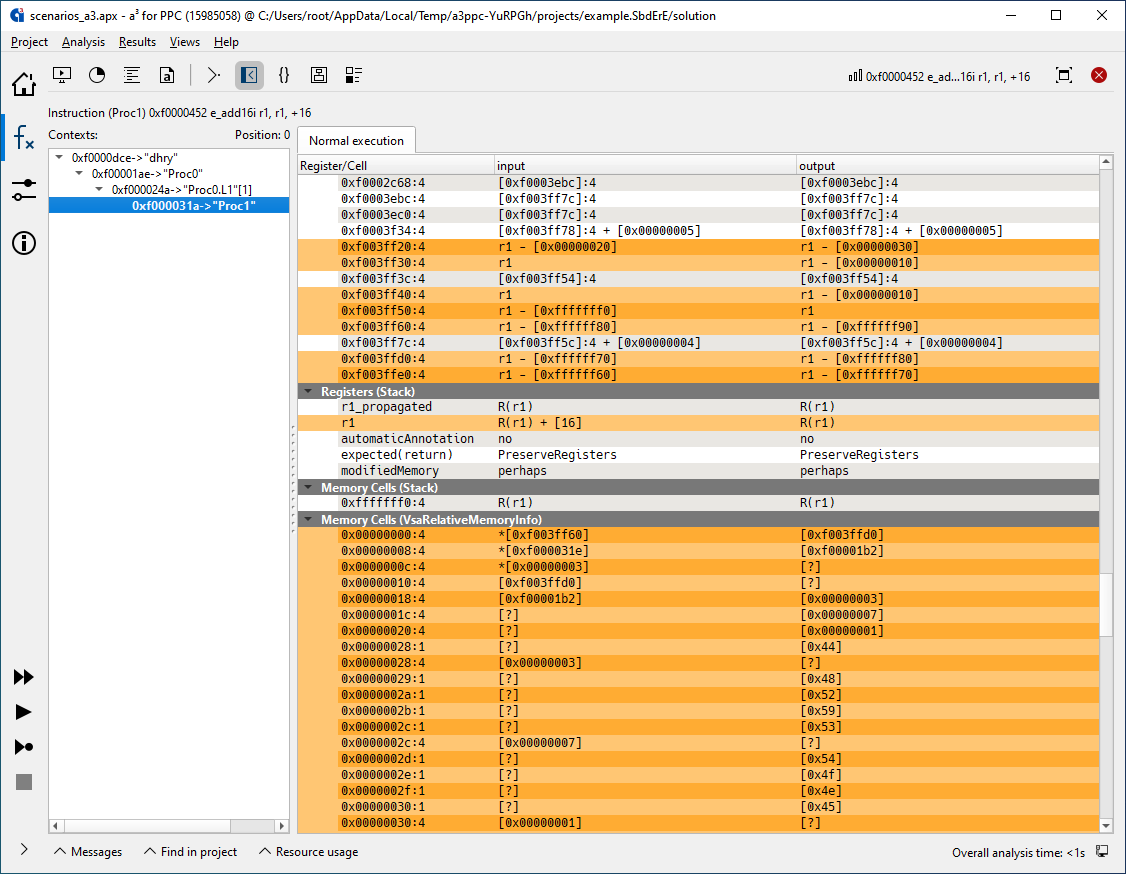 Contents of registers and memory cells
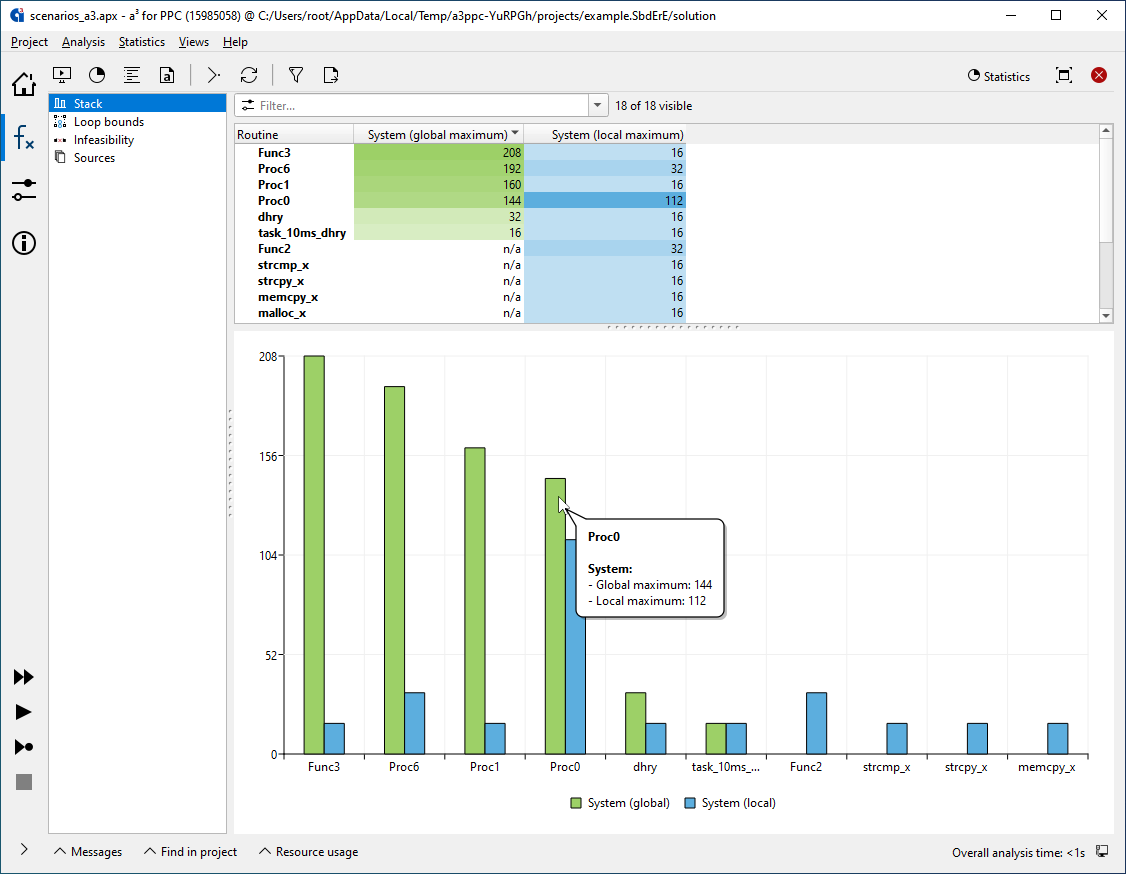 Tabular overview of the stack usage
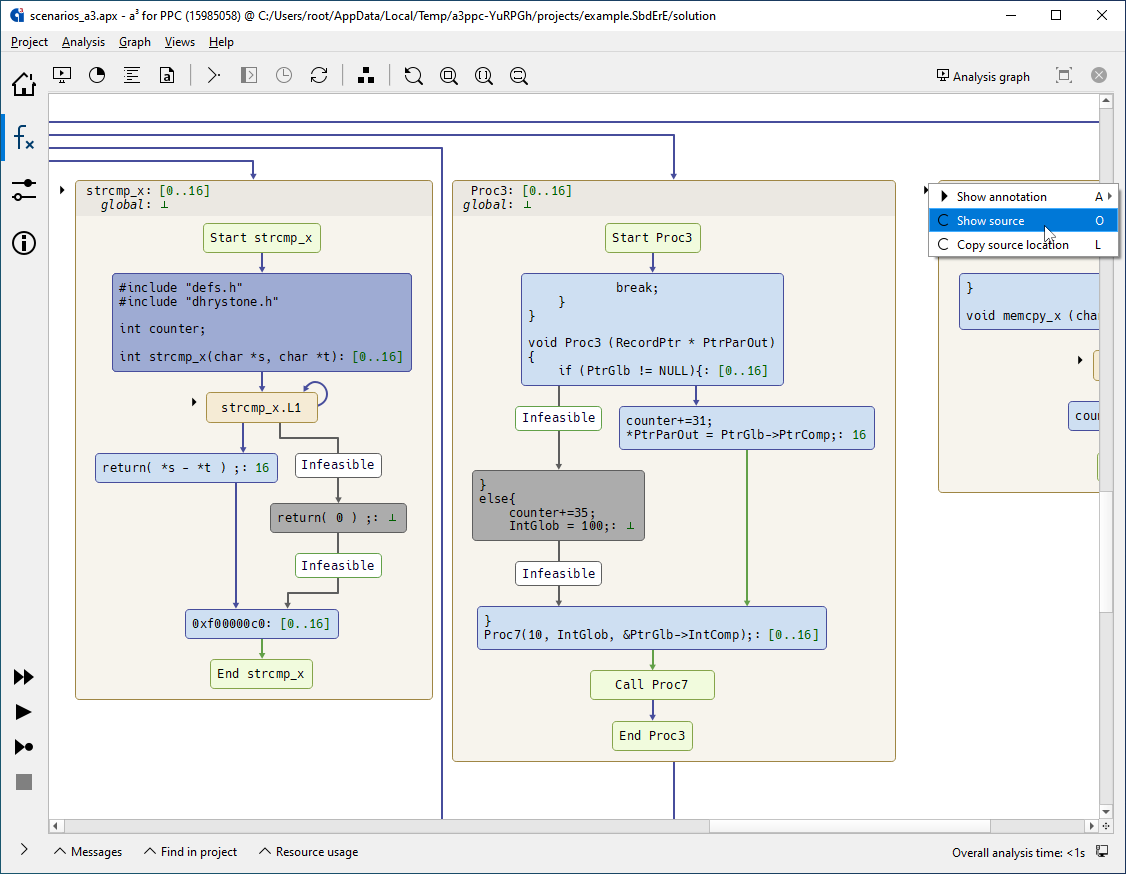 Control-flow graph with analysis results
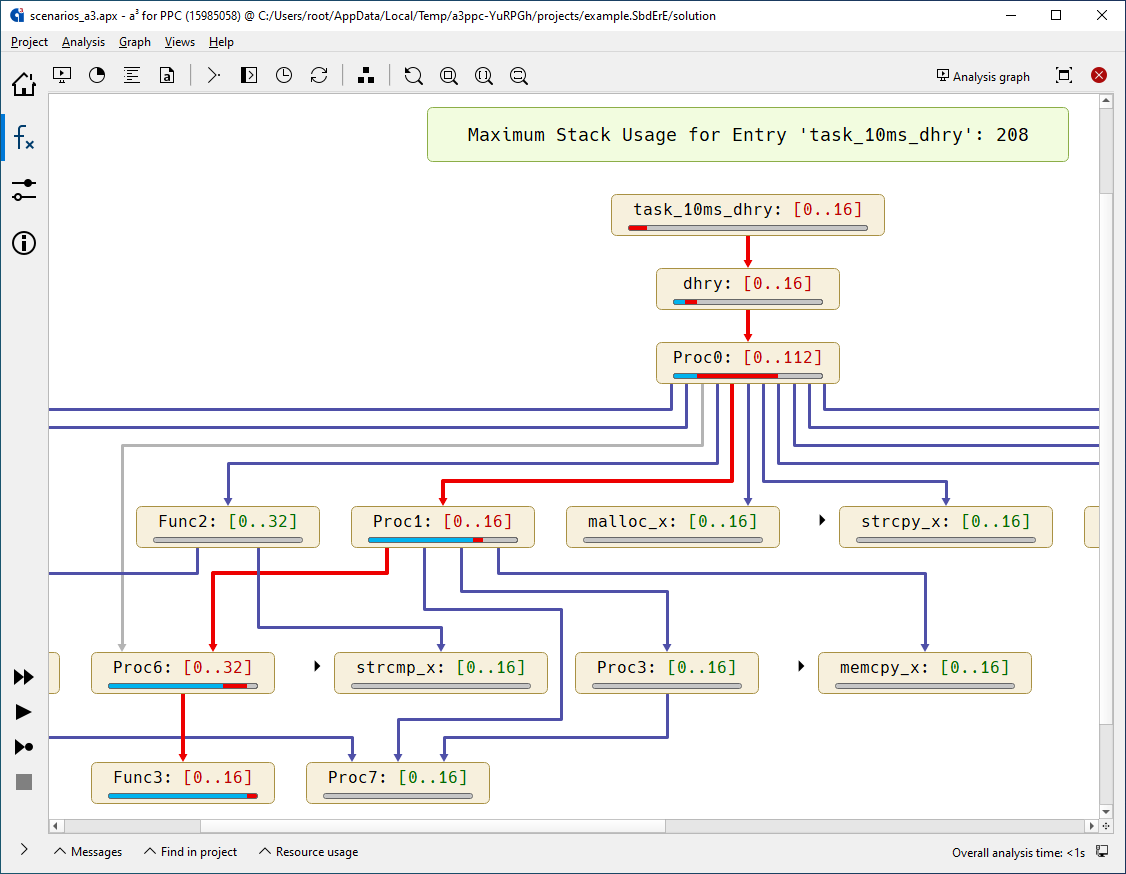 Call graph with worst-case stack usage
Your benefits
- StackAnalyzer reduces the development effort and helps prevent runtime errors due to stack overflow.
- StackAnalyzer calculates the stack usage automatically. No testing or measuring required. The analysis results are valid for all inputs and any task execution.
- StackAnalyzer directly analyzes binary executables, exactly as they are executed in the final system. It requires no code instrumentation, no modification of your system, no modification of your toolchain, and it will not be confused by potential flaws in debug information.
Static analysis is a must
- Using StackAnalyzer is essential in meeting current safety standards such as ISO 26262, DO-178B/C, IEC-61508, and EN-50128, where statically analyzing the stack usage is part of the architectural safety requirements.
- CISA and FBI designate stack overflows as “unforgivable defects” that pose “unacceptable risk to national and economic security“, and urge developers to “conduct aggresive adversarial product testing, including static analysis.”
Who uses StackAnalyzer?
Airbus France, in the development of safety-critical avionics software for several airplane types, including the A380.
Daimler, in many automotive software projects, including the powertrain control system of the Actros line.
Honda, in developing the FADEC software of a turbofan engine.
Vestas, to prevent stack overflow in their wind turbine control software.
Framatome, for verification of their safety-critical platform for testing, operating and troubleshooting nuclear reactors.
Continental, to avoid stack overflows in their airbag control systems.
OHB, in the development of onboard software for satellite platforms for communication and navigation.
u-blox, to avoid stack overflows at compile time and to increase the reliability of their controlling software.
MTU Friedrichshafen, to demonstrate the correctness of control software for emergency power generators in nuclear power plants.
A multitude of supported processors
StackAnalyzer is available for a vast variety of instruction set architectures, including ARM, PowerPC, x86, TriCore, RISC-V, and 20+ others.
Supported compilers include GCC, GNAT, LLVM/Clang, Diab, Tasking, GHS, the formally verified CompCert compiler, and 10+ more.
A breeze to use
StackAnalyzer incorporates two decades’ worth of feedback from commercial users and offers many helpful features, polished over the years.
- Static analysis of binary files, exactly as they are executed in the final system.
- Clear and precise information on the maximum stack usage by tasks, functions, basic blocks, and individual instructions.
- Recursions, function pointers, inline assembly code, and library-function calls are all taken into account.
- Automatic recognition of dead code.
- Exceptionally fast analysis of complex real-world software.
- Freely selectable entry points for the analysis, so you can focus on the worst-case path or other areas of interest, and speed up the analysis even further.
- Difference analysis for comparing the stack usage before and after making changes to your system.
- Customizable XML reports for documentation and certification.
- Feature-rich GUI with interactive views for analysis results, statistics, code coverage, control flow, source code, assembly code, DWARF debug info, symbol tables, configuration files, and more.
- Command-line mode for easy integration into automated build processes.
- Plugins for TargetLink and Jenkins. Fully-integrated custom builds for SCADE and Raptor.
- ValueAnalyzer add-on for static analysis of register and memory cells, memory accesses and function calls.
- Seamless integration with other analysis tools from AbsInt, e.g. aiT for static analysis of the worst-case execution time.
- Qualification Support Kits for ISO 26262, DO-178B/C, and other safety standards.
- Regular updates and excellent tech support.
“When searching for actual products performing stack usage analysis for embedded software, StackAnalyzer seems to be the most promising (and probably only) choice.”
Independent review by the University of Erlangen
Seamless integration into your toolchain
StackAnalyzer supports tight integration with state-of-the-art development tools, including:
- SCADE Suite, the market-leading embedded-software development environment from ANSYS
- Jenkins, the leading open-source automation server
- TargetLink, the production-code generation tool from dSPACE
- SymTA/S scheduling analysis tools from Symtavision/Luxoft
- RT-Druid, the Eclipse-based development environment from Evidence
- Raptor-Dev, the system-development toolkit from New Eagle
StackAnalyzer can also be combined within a single user interface with other analysis tools from AbsInt — e.g. aiT for worst-case execution time analysis.
Qualification support

Your usage of StackAnalyzer can be qualified according to ISO 26262, DO-178B/C, and other safety standards. We offer special Qualification Support Kits that help you simplify and automate your qualification process. These Kits are especially popular with our customers in the avionics and automotive industries.
See for yourself
You can try StackAnalyzer for free, on your own applications, for a period of 30 days. The free license covers:
- One supported ISA of your choice
- Any number of supported compilers
- The ValueAnalyzer add-on
- More than one physical machine if needed, but no VMs
- Windows, Linux, or both
Request your free trial package today, complete with free online training and tech support.