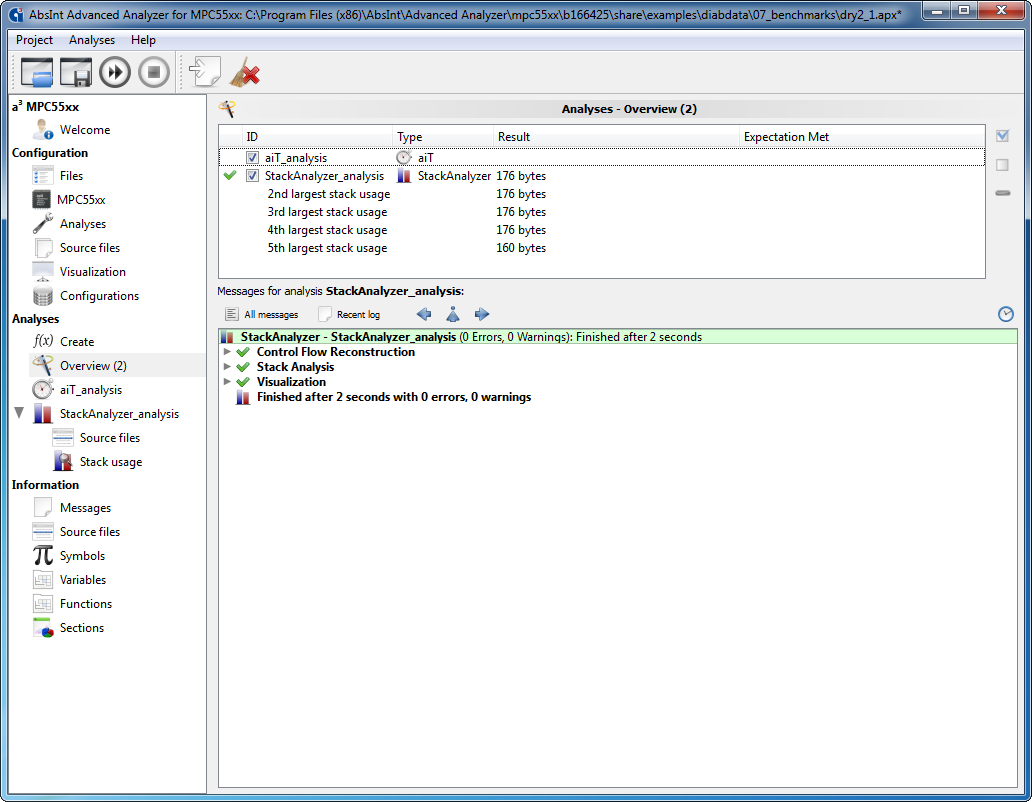
Worst-case stack usage paths
Stack analysis now allows to compute the N worst-case stack usage paths. The extended output is available in the report file as well as in separate GDL graph files.
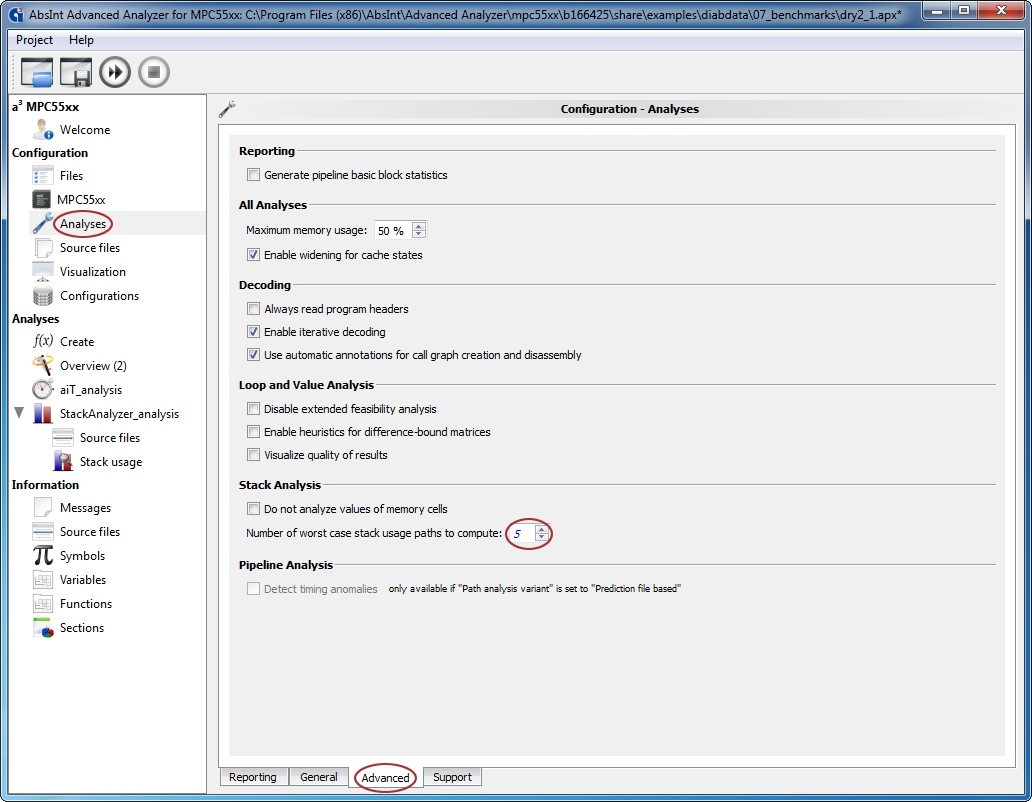
This feature can be found under “Configuration” → “Analyses” → “Advanced” → “Number of worst case stack usage paths to compute”.
Improved messages
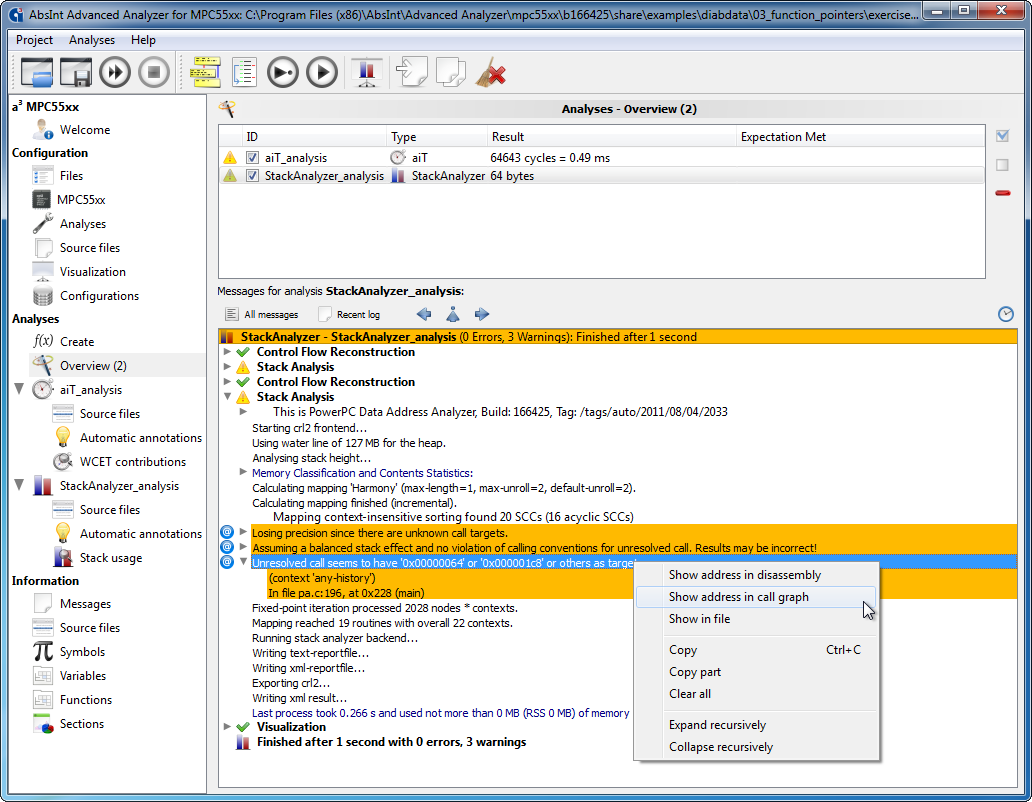
- Improved coloring, grouping and folding of errors and warnings.
- Added buttons for navigation between error messages and warnings in analysis results.
- New entry in the context menu allows going to the selected point in the graph.
- Improved text selection.
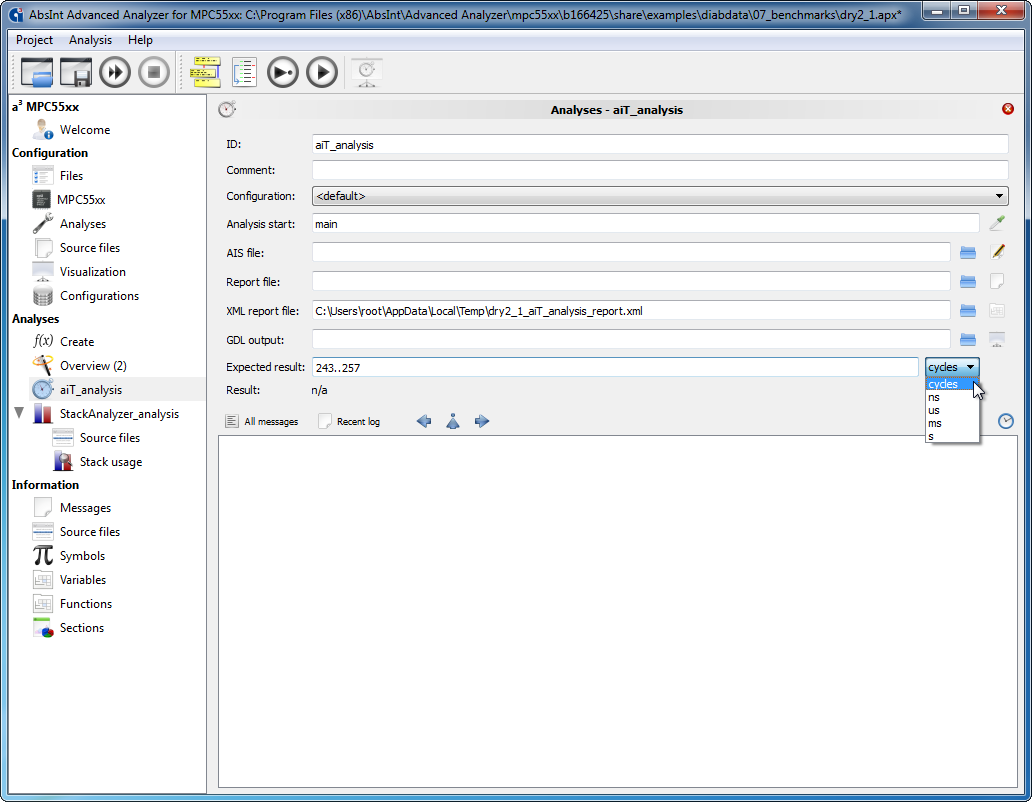
Checking WCET against expected results
aiT now allows to define an expected result for the WCET analysis. The computed result is checked against the expected result, and an error is issued if it does not match. You can specify an upper limit, a lower limit, or a range for the WCET which must be met. The limits can be specified in cycles or time units.
Improved performance
Symbols/sections and debug information are no longer loaded automatically, but only on demand.
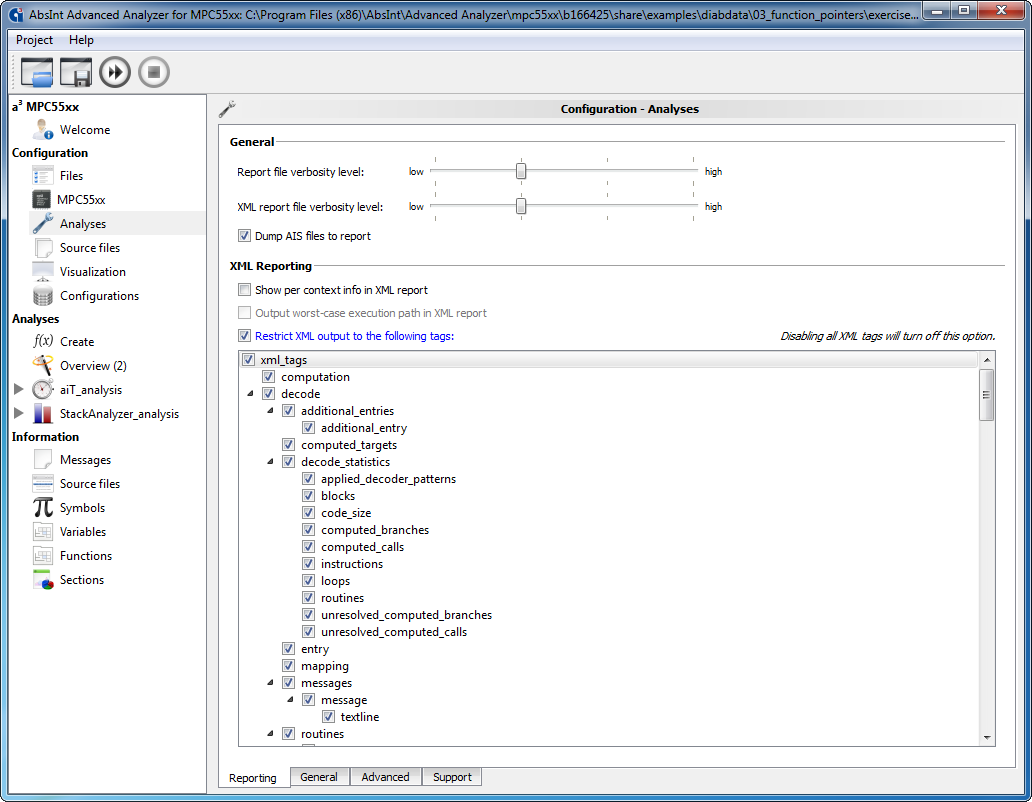
Fully customizable XML reports
a³ now allows to set message verbosity level, enable/disable context sensitive information, and filter individual tags.