Workspaces
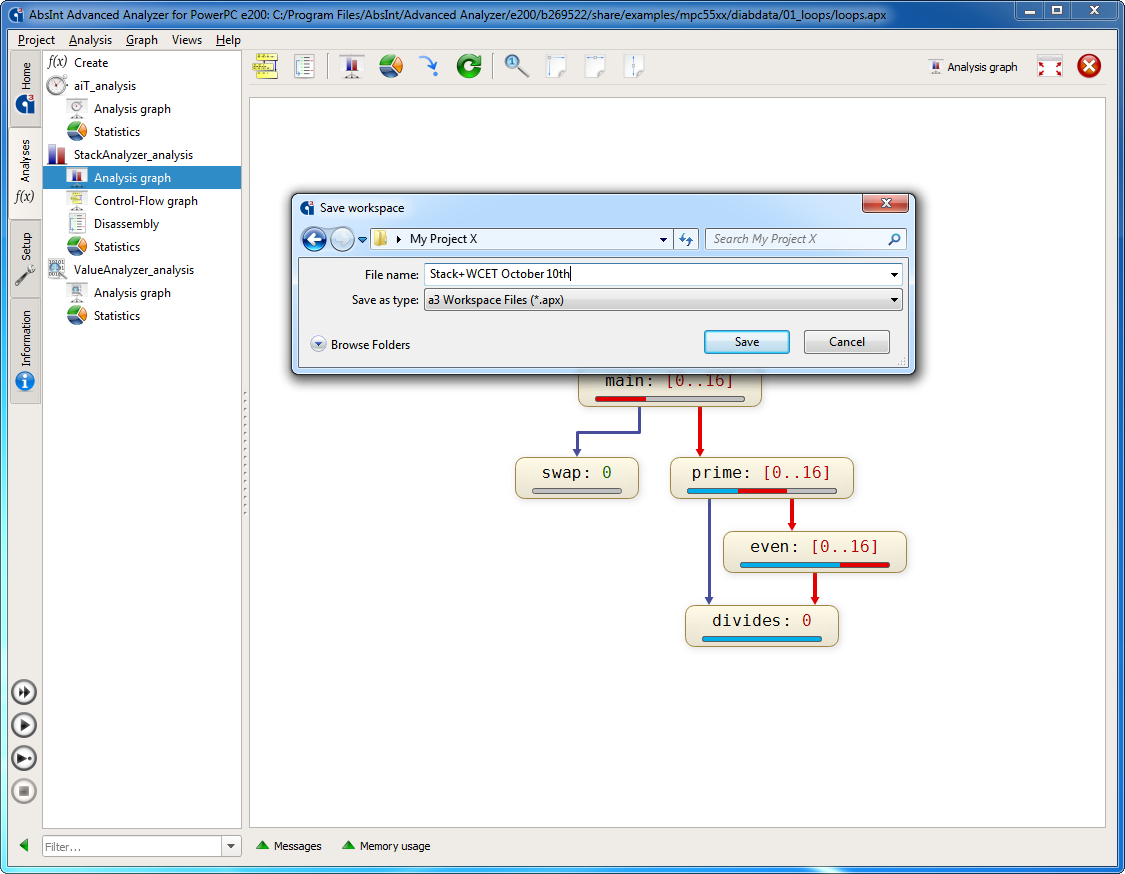
You can now save the current analysis state, any results computed so far, and all currently open views as a so-called Workspace.
Unlike simply saving a project, this allows you to take snapshots of your progress, revisit them, and build upon them. Whenever you open a Workspace, all the graphs, statistics, etc. are immediately there, without having to re-run the analyses first. This is especially useful for documentation and backup purposes.
In the user interface, this new feature is accessible via “Project” → “Save as workspace”.
To load a saved Workspace, use “Project” → “Open” as you normally would, but then instead of the main project file select a Workspace of your choosing (which is an APX file as well).
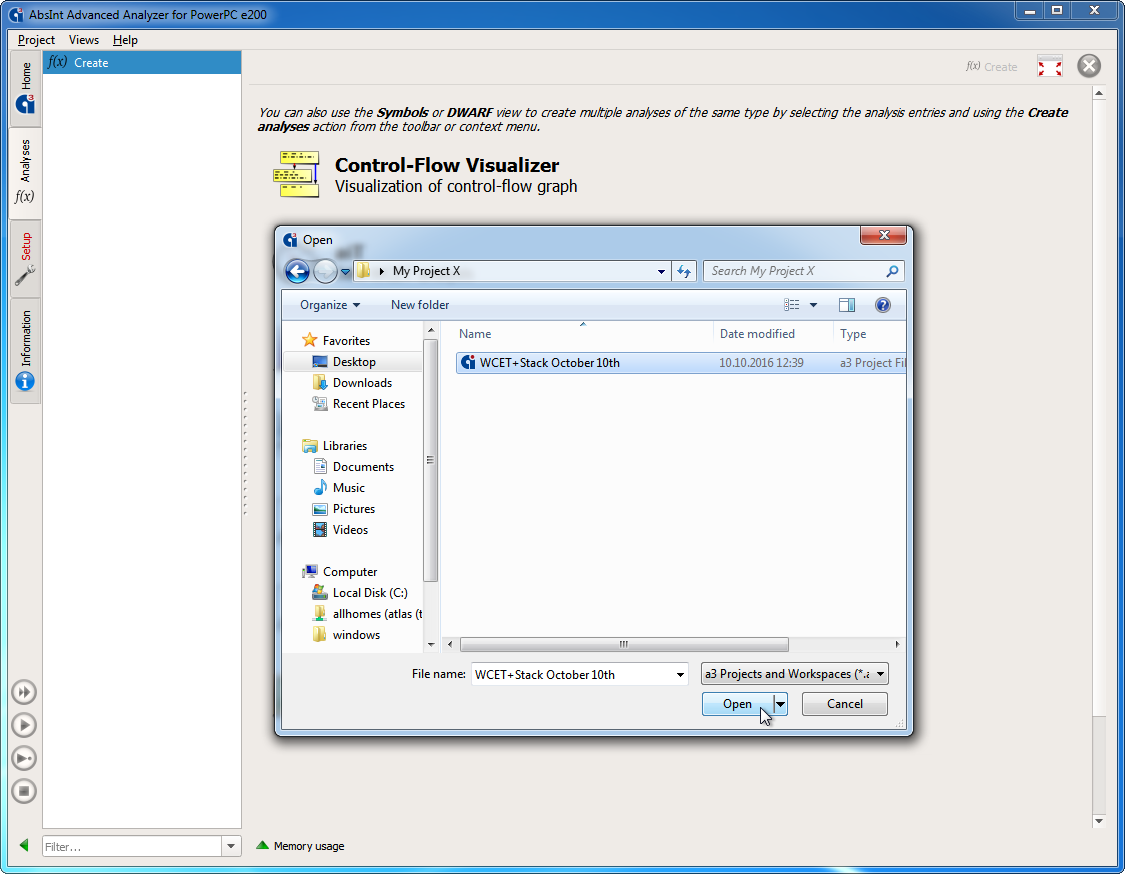
Opening a previously saved Workspace
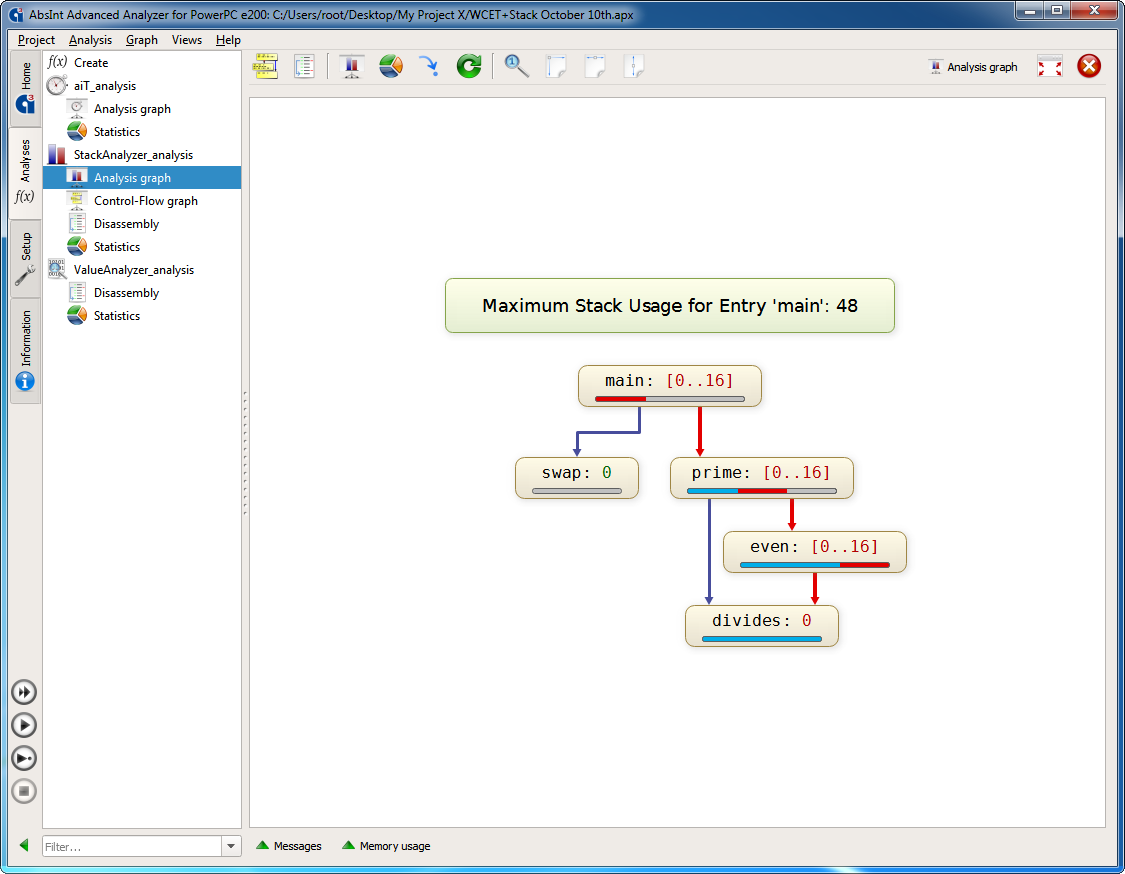
All the results, stats and graphs
are immediately loaded just as you left them
When running a³ in batch mode, you can export
analysis results as a Workspace via --export-workspace <workspace.apx>.
Again, if you then open that Workspace in the GUI, all analysis
results, graphs and stats will be immediately available without
re-running anything.
Here is a complete sample command line for running the analysis in batch mode and archiving all results as a Workspace:
alauncher -b --export-workspace results.apx project.apx
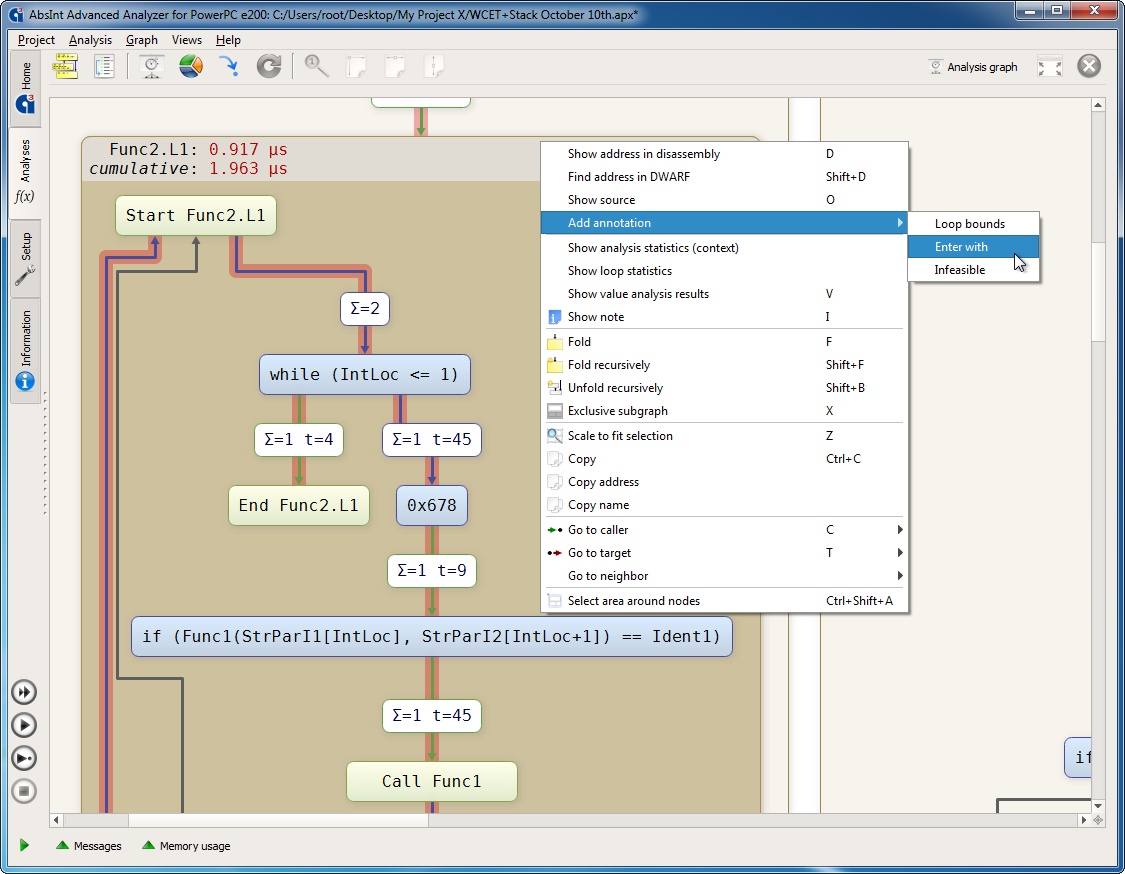
Point-and-click annotations
Annotating your project is now easier than ever before. Whether you are looking at a graph or a statistics table, simply right-click on a routine or loop and select “Add annotation” from the context menu.
You will then be taken straight to the AIS file, with the selected annotation already typed out for you. Now simply fill in the values as desired, and you’re done.
Likewise, in the AIS editor itself you can now use “Insert AIS annotation” from the context menu to add further annotations, rather than typing everything by hand.
Annotation hints

a³ now automatically determines any locations that should benefit from being annotated, and marks them for you with a light bulb in graphs and messages.
Clicking on that symbol will bring up the suggested annotation, and another click will add it to your AIS file.
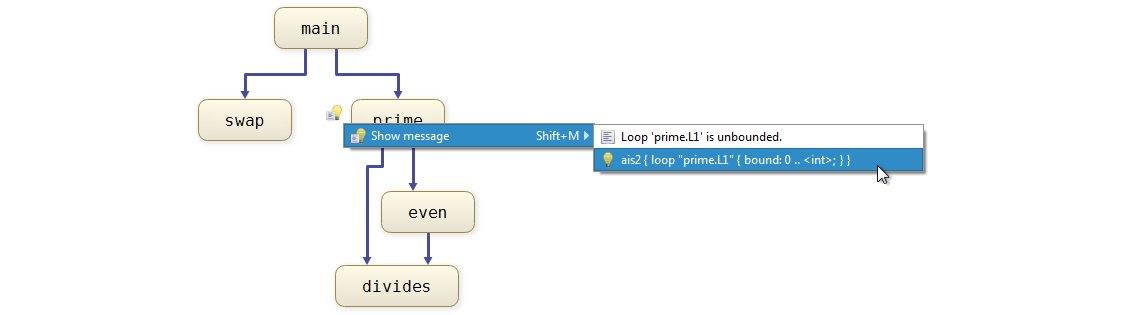
The annotation hints are also included in analysis reports for documentation purposes.
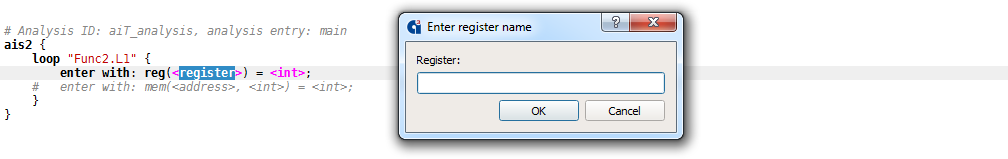
Below are some examples of messages with annotation hints. Placeholders enclosed in angle brackets are highlighted in the GUI and can be double-clicked on to enter values of your choosing.
- Missing call targets:
exec2crl: Info #1027: In "error.c", line 41:
In routine 'os_ErrorHook', at address 0x180138c:
Unresolved computed call in routine os_ErrorHook.
Annotation hint:
ais2 { instruction "os_ErrorHook" -> computed(1) { calls: <targets>; } } - Missing loop bounds:
Info: In routine 'main.L3', at address 0x1001b4:
Loop 'main.L3' is unbounded.
Annotation hint:
ais2 { loop "main.L3" { bound: 0 .. <int>; } } - Missing incarnation bounds:
Warning #3097: In "fibfac.c", line 1:
In routine 'fac', at address 0x180029c:
For routine 'fac' the default incarnation limit of 1 is used.
Please verify that this is correct.
The recursion details are:
0: main
1: fac
-> 2: fac
-> 3: fac
Annotation hint:
ais2 { routine "fac" { incarnation limit: 1; } }
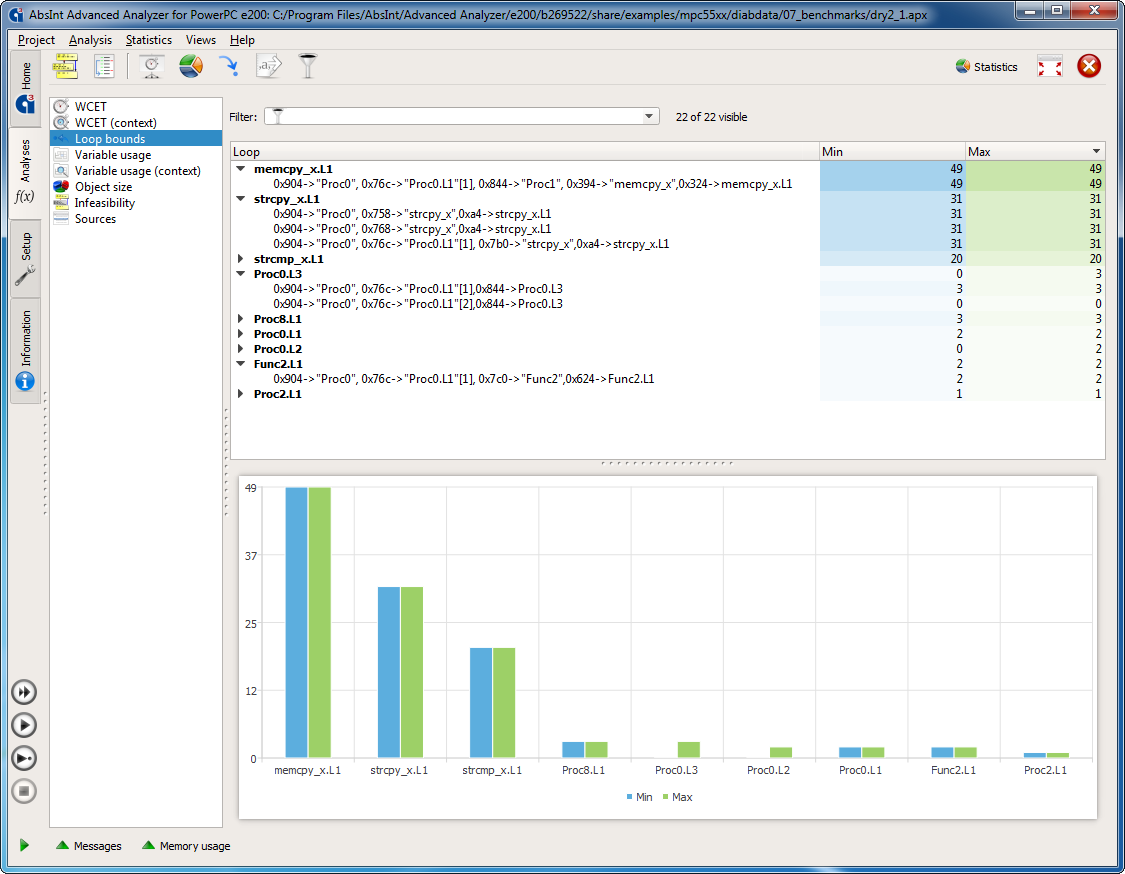
Improved statistics
- All-new Statistics view for minimum and maximum loop bounds for all loops globally and for each context.
- In the Graph view, the loop statistics and other analysis details are now linked from the context menu of routines and loops, rather than being shown as additional notes in the graph itself.
- The WCET statistics views have been extended with bar charts for self contributions and cumulative contributions.
- The Infeasibility statistics view has been extended to mention if a routine is top-level infeasible, backwards infeasible or just infeasible.
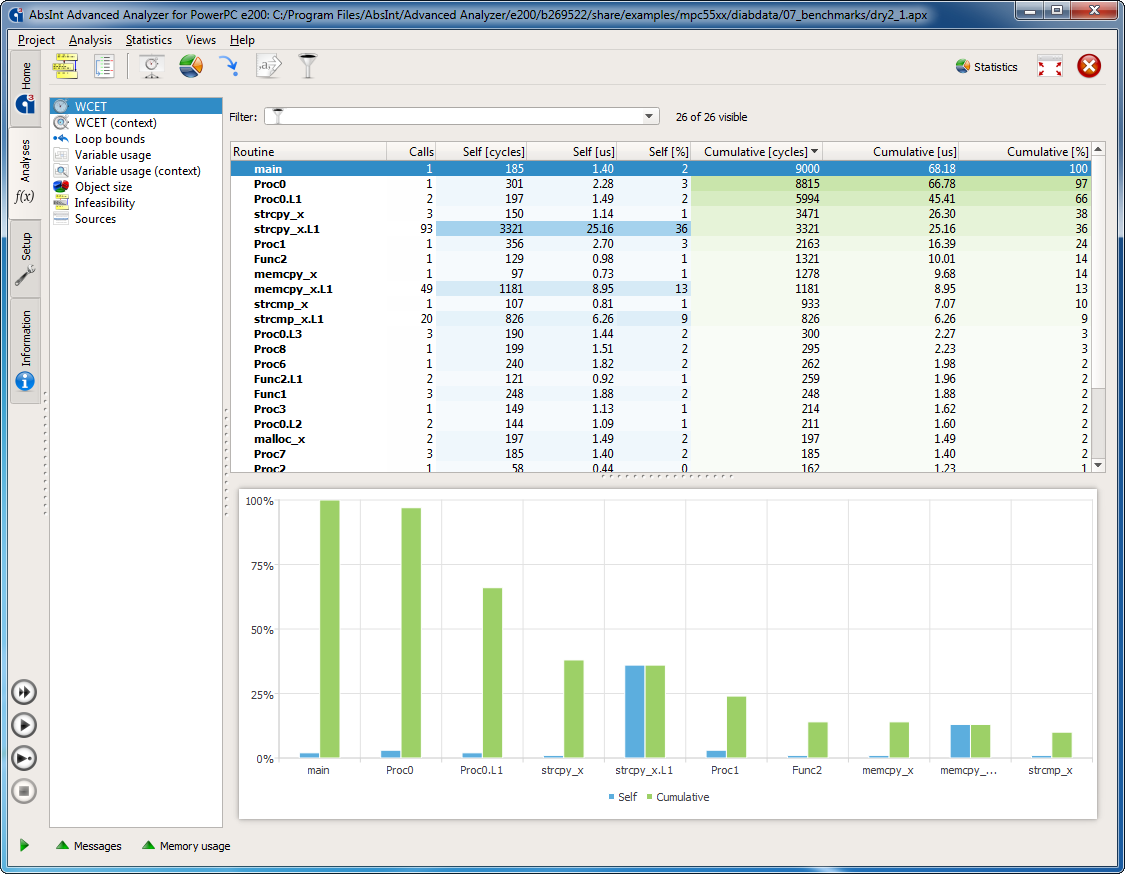
Extended WCET stats
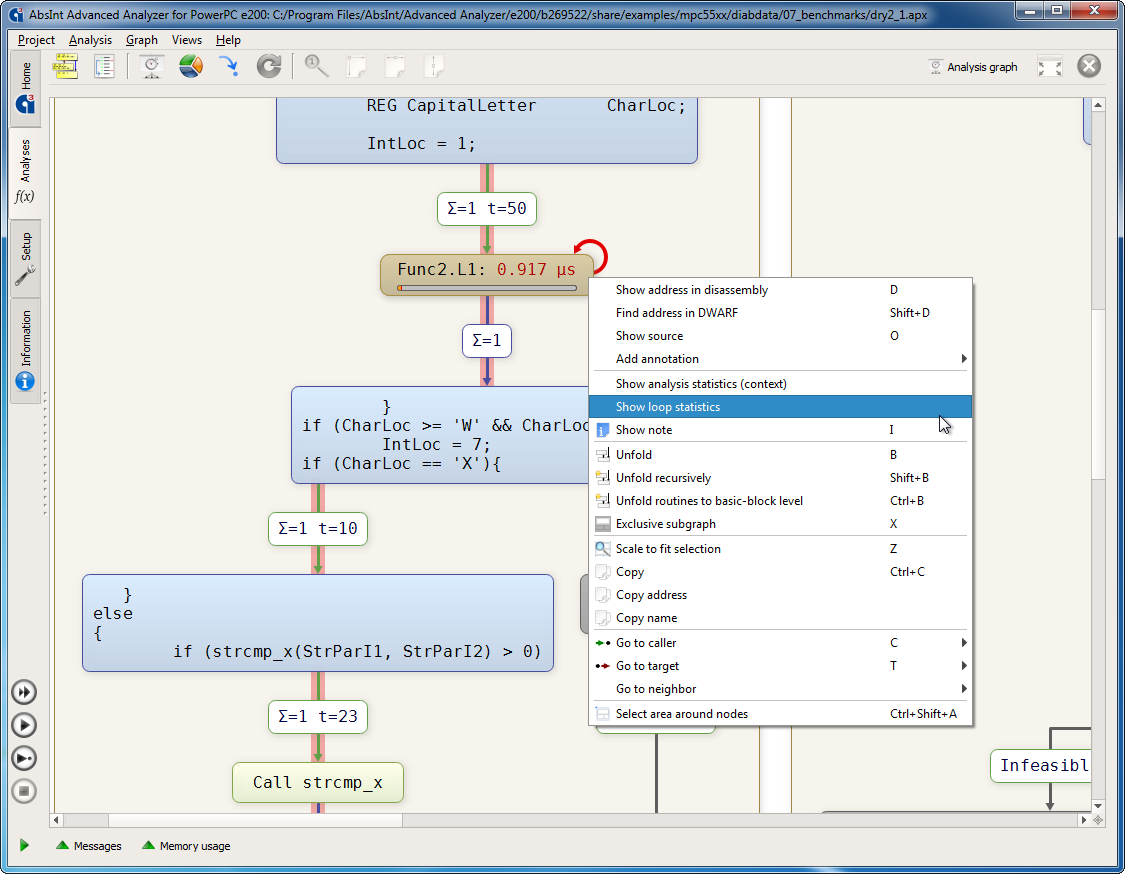
Loop stats linked from graphs
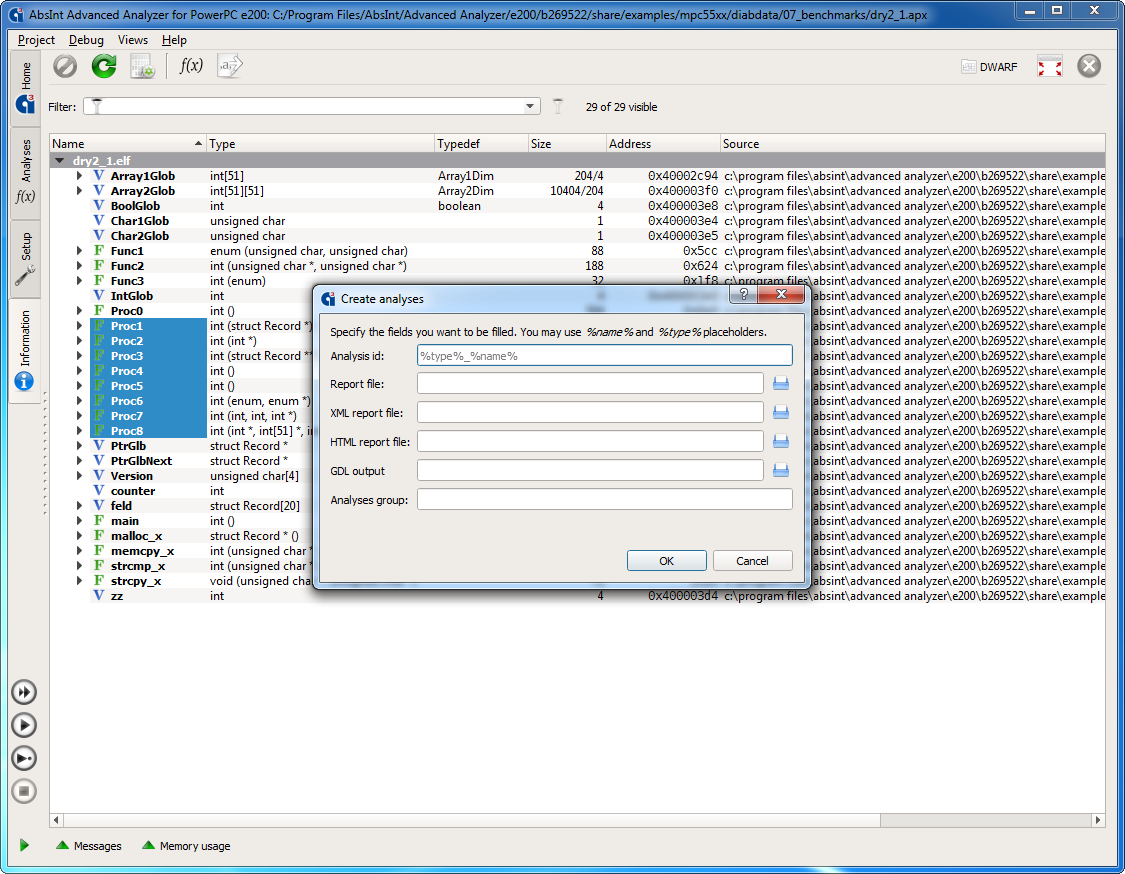
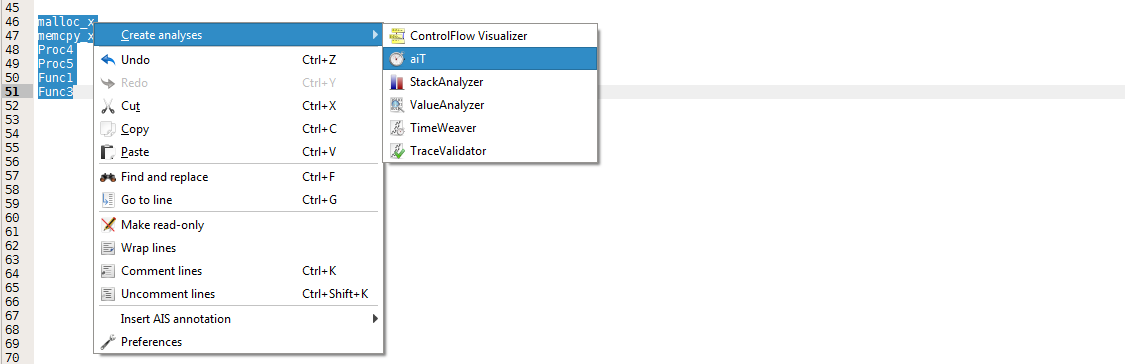
Easier mass-creation of analyses
When creating analyses from an information view, a template dialog is now displayed that enables you to customize them.
In addition, you can now mass-create analyses simply by typing up the list of entry functions in any editor view and using the context menu.
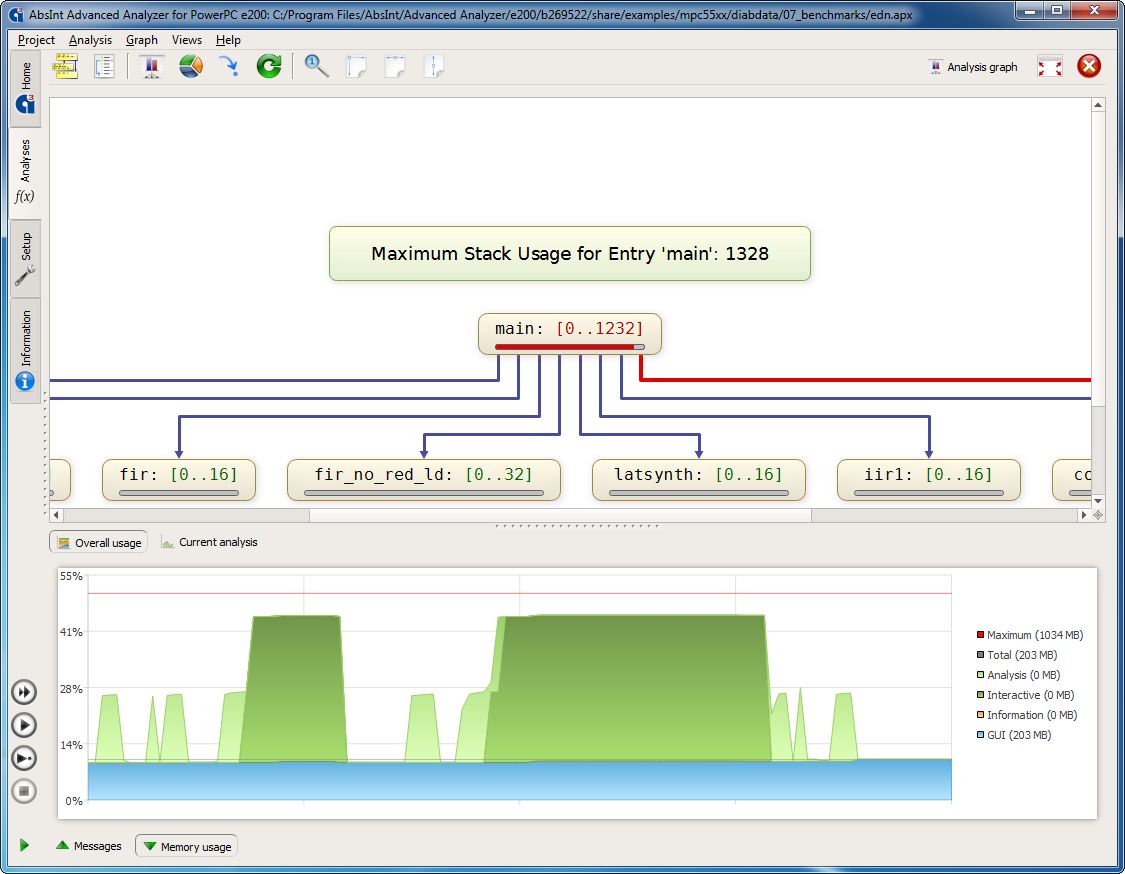
Improved Memory Usage view
- The memory usage is now broken down by category.
- You can now toggle the view between overall usage and that of the current analysis.
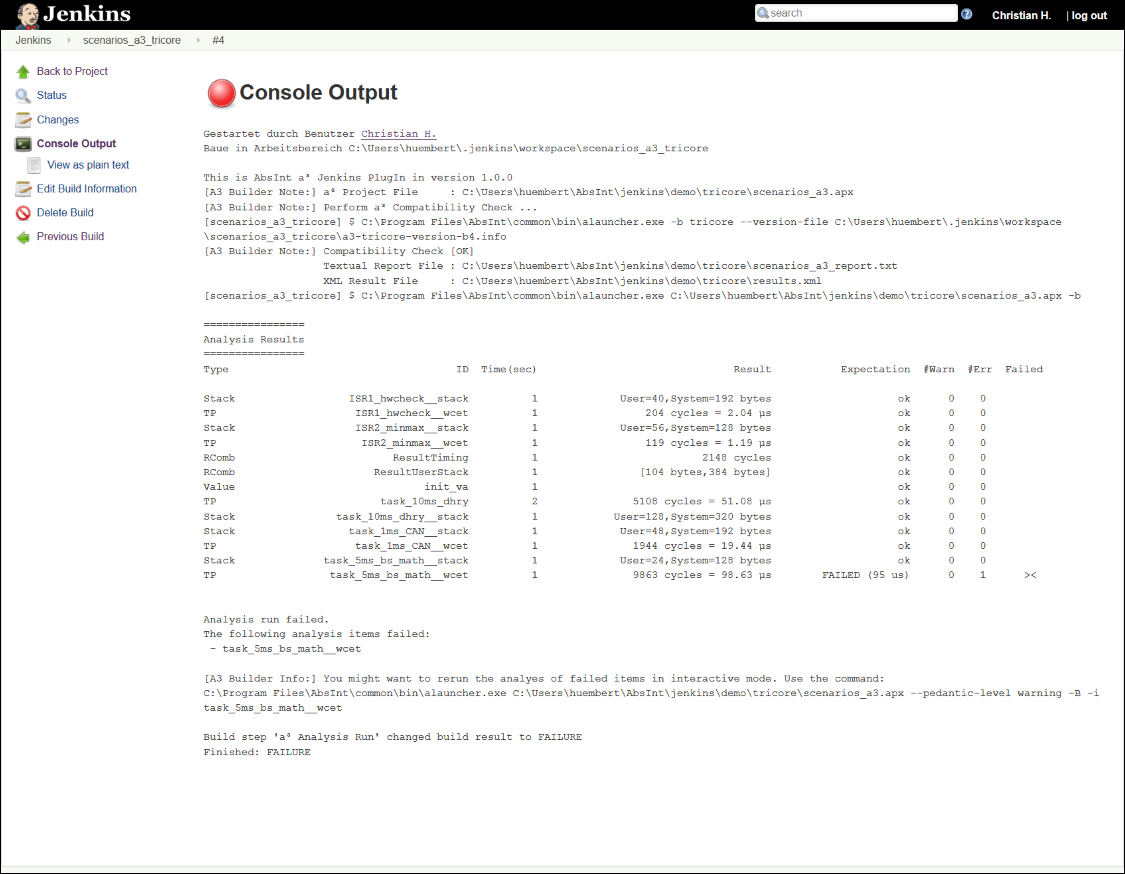
Jenkins plugin
a³ can now be easily integrated in Jenkins, the leading open-source automation server. Simply download our free plugin from either jenkins-ci.org or GitHub.
The plugin allows you to:
- Automatically determine the maximum stack usage and worst-case execution time of your Jenkins builds
- Find dead code, verify the absence of illegal memory accesses and function calls, or discover other violations of your spec
- Automatically mark a build as failed depending on analysis results according to your own criteria, such as
- surpassed thresholds

- other violated expectations
- specific warnings or errors
- Access detailed analysis results via the Jenkins web interface
- View a compact summary of the analysis results and failed items in the Jenkins build output
- Archive report files directly to your Jenkins workspace