New targets
- ValueAnalyzer and StackAnalyzer for RISC-V
- aiT for TriCore TC3xx (AURIX 2nd GEN)
Qualification Support Kits

- New compiler-specific QSKs for:
- StackAnalyzer for PowerPC with diab-5.9.4.8
- StackAnalyzer for PowerPC with gcc-4.9.3
- StackAnalyzer for x86 with gcc-4.9.4
- The Safety Manual has been extended with ISO-26262 V2.
- QSK execution now validates all input and output XML files.
- The test
qk_ais2_expression_pp_area_operatorsnow checks functor align. - Additional test cases:
qk_ais2_routine_timing
qk_ais2_for_loop_annotation_scopeall architectures qk_ais2_non_virtual_function_calls all except C16x and dsPIC qk_setting_spe_instruction_set e200, PowerPC qk_setting_user_specified_memory_map TriCore qk_setting_syscall_base_pointer
qk_setting_callt_base_pointerV850
Improved performance
- Faster gzip compression across the board (projects, support archives, zipped input files).
- Improved resource usage of the ILP solver, the trace path analysis, the AbsInt License Manager, and the cache analysis for SPARC.
- The GUI is now more responsive for projects with many analyses.
- Faster decoding.
- Faster trace parsing and conversion.
- Faster stack analysis, value analysis, loop analysis, and path analysis.
- Faster batch mode.
Project setup
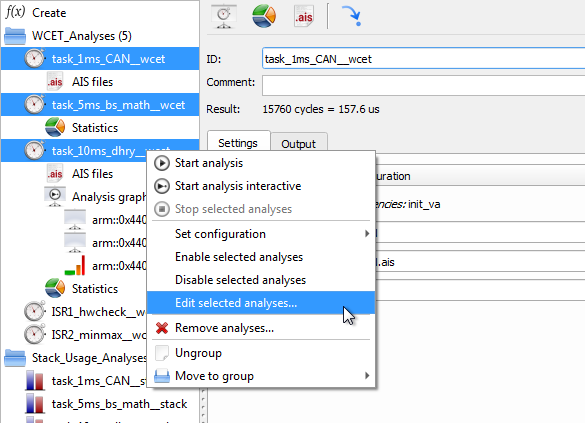
- Several analyses can now be edited at once. If more than one analysis is selected in the list of analyses, either in the section Analyses or under Home → Overview, the context menu now offers the command “Edit selected analyses”.
- Setup → Files has been split into the tabs Input and Output.
- The Show/open file button can now be right-clicked to copy the file path action.
- Trace files are now configured globally under Setup → Files.
- Global text report and XML result files are now configured under Setup → Reporting.
Visualization & results
- In the result graph, the hierarchy of recursions is now shown in a recursion selection combo box.
- Widening points are marked by a blue border in the control flow graph. This allows to inspect imprecision due to loss of information by widening in the interactive value analysis.
TriCore
- Support for a user-specified memory map that overrides all GUI settings.
- Peripheral address space (segment 15) is now marked as volatile by default.
Other improvements
- Global symbol table entries can now be filtered by entries that are reachable by the given trace files.
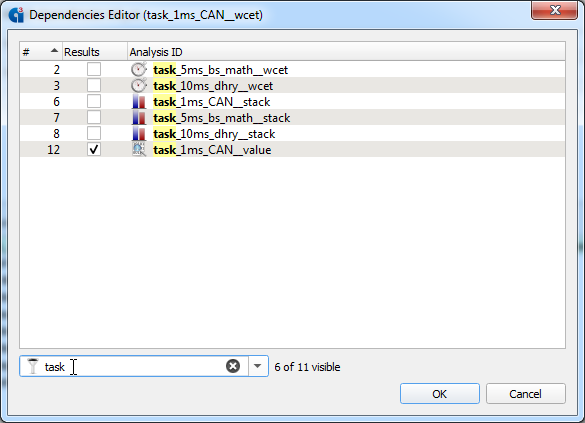
- Improved analysis dependency editor that allows filtering.
- The OSLC adapter can now choose a free port for http server binding.
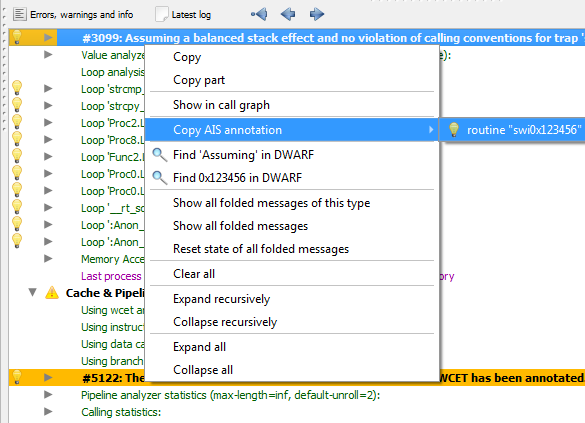
- Annotation proposals by the GUI are no longer automatically added to the local AIS file. Instead, a new context-menu entry, available both in the Messages window and in the Graph window, lets you copy the suggested annotation to the clipboard and then choose for yourself which AIS file to paste it into.
- The “Show in file” context menu action now both highlights the associated line and moves the text cursor to the appropriate column (when known).
- Analyses can now be filtered via Ctrl+F on the Overview page.
- Improved performance of GUI for projects with many analyses.
- Improved performance of batch mode.
- Improved handling of concurrent analyses. Concurrency can now be adjusted even if analyses are already running.
- Improved global search.
- Improved context navigation via keyboard in interactive value analysis.
- Improved search for addresses in the Sections and Symbols views. In addition to the exact matches for the address in question, the list of results now also includes entries that don’t expressly mention that address but do contain it somewhere in their range.
New annotations and expressions
- New annotation to annotate single-entry-exit-regions with a time (like routine/loop takes):
routine "max" snippet 0x25c to 0x238 takes: 10000 cycles;
- The global "Size limit for value sets" can now be overwritten
per instruction/routine:
# size limit of 64 inside the "msgHandler" routine routine "msgHandler" { attribute "size_limit_for_value_sets": 64; } # size limit increased to 128 for the 4th read of the "msgHandler" routine instruction "msgHandler" -> read(4) { attribute "size_limit_for_value_sets": 128; } - New expression for generating sets of values using value set comprehensions,
similar to set comprehensions in Python:
[ <expr_var> for "<name>" : <i> to <n> ]
where<expr_var>is any kind of expression that (may) reference the variable<name>viavar("<name>"), and<i>and<n>evaluate to signed integer expressions specifying the first and the last value of the variable<name>.[ <expr_var> for "<name>" : <expr> ]
where<expr_in>is any kind of expression which may resolve to a set of values used as inputs for the variable<name>.
Example:
# Generate a set of values that contains all integers from 3 to 47 [ var("i") for "i" : 3 to 47 ] - New variant of WCET contributions of code snippets annotation:
routine "func" snippet 0x254 to 0x238 evaluate as: "test";
This variant will only include the blocks/edges into the evaluation region that are in-between the start and end of the region ignoring any incoming/outgoing edges that miss the start/end locations.
For called routines the cumulative time is used. If some of the cumulative times coudn’t be computed, an error is reported.
- Annotations that refer to source code can now use the
matchfunctor for better portability. The regular expression is always matched case insensitively to allow easier portability between different operating systems.instruction source(match("Os.+/TaskSwitch\.h"), 73) -> computed(1) calls: ...; - The mem functor now accepts complex area specifications:
mem(address(("MK_isrCfgTable"[] { index: 0; }."nu")),
      width(("MK_isrCfgTable"[] { index: 0; }."nu")))
Value partitioning
Support for partitioning over multiple variables at once.
For example, the below annotation will create 2×2×3×3 = 36 partitioning contexts:
instruction "test_instruction" {
   begin partitioning:
       restrict reg("r10") = [0,1],
       restrict reg("r12") = [0,1],
       restrict mem(address("test1"), 1) = [0,1,2],
       restrict mem(address("test2"), 1) = [0,1,2];
Paged architectures
- Improved resolving of instruction program points.
- Improved handling of complex program points reading pointer targets.
- Introducing
base skipped: null;for complex program points, for ignoring pointers with a NULL base address but a non-NULL page number.
Other improvements
- Faster annotations resolver.
- Improved handling of the annotations
returns: never;andreturns: immediately;for unresolved trap routines. - Improved handling of
returns: never;for code snippets that are annotated as not analyzed viainstruction ... target not analyzed; - Improved handling of the
<pp>condition annotation. - Improved handling of the
matchfunctor. - The
entriesfunctor has been improved to work with non-constant inputs (e.g. user registers). - Improved search scope for routine type information for the functors
index_of_parameterandnumber_of_parameters. - Complex program points that resolve via pointers now automatically
skip NULL pointers. This behavior can be configured with the
skippedattribute. - Complex program points that resolve via pointers allow reading pointer targets from writable sections. This behavior can be controlled by declaring the associated memory area as read-only or as volatile.
- Source code annotations may now resolve to multiple program points which now allows source code annotations to work properly for inlined code.
- Improved evaluation of expressions.
- Improved error output of the expression evaluator.
isa-ppc: error: in "warning_1.ais", line 8, column 19:
Computing range: No matching switch case, result is empty.
Please correct your annotation, results may not be correct.
Expression arguments: switch(reg("r5") = 3) {
2 => 297000000,
4 => 297000000
}
Decoding
- Copy tables are now applied considering mirrors of memory areas.
- Support more types for symbols from AOL files.
- Auto-detect Motorola S-record via the .s19 suffix.
- Improved performance of switch and call table resolution.
- Improved handling of copy tables by allowing partial initialization of larger sections.
Taint analysis
- The register-relative memory analysis is now augmented with taint information. For example, the tool keeps track of which stack-pointer–relative memory cells have been written to. When returning from a call, this information is then used to improve memory contents.
- It is also tracked which registers are tainted (written to) by a routine. Upon returning from a call, registers untainted by the called routine are then restored to their pre-call value. This improves the precision in combined contexts.
- The register taint info is also used for the relational domain. For all registers unaltered by a called routine, all the pre-call relations involving those registers (and other unaltered values) are restored after each call.
Loop analysis
- Improved performance.
- Improved loop bound deriving based on array heuristics.
- More resources are now considered to be a possible loop counter.
- Better sharpening of register/memory cells based on computed loop counter ranges.
Value analysis
- Improved precision of:
- the relational analysis
- the sharpening of sub-registers
- the sharpening for operands of branch conditions
- The analysis now assumes the memory contents are not modified for unresolved computed calls. This improves the resolving of such calls via iterative decoding.
- Improved detection of register relative memory accesses.
- Improved detection of stack relative addressing for higher precision via the stack-relative memory info domain.
- Improved coupling of absolute and relative memory information.
- Various improvements to array heuristics, such as ignoring null pointer base addresses.
- Improved performance of combine and widening inside value analysis.
- Annotation hints are now provided on more warnings than before.
Stack analysis
- Improved performance.
- Improved precision in general, as well as for code with stack alignment in particular.
- The widening delay no longer affects the stack analysis domain.
Target-specific improvements
- ARM: improved handling of HBF AArch64 binaries.
- C16x: improved automatic resolving of computed calls.
- FR81 FeOMF: now marking all sections as allocated, except those classified as DUMMY.
- HCS12: support for more addressing modes for branches and calls.
- MCS251: the
illopinstruction is now handled like end of program. - PowerPC:
- The analyzer already knows the special-purpose registers
spr1 (xer),spr8 (lr),spr9 (ctr), andspr272–spr279(sprg0–sprg7). Additional special-purpose registers can now be declared using an annotation of the form:attribute "sprs" : { "spr308" = 32, "spr309" = 32, "spr310" = 32, "spr520" = 64, "spr730" = 64 }; - Improved support for SPE2 instruction set extension.
- Improved stack relative memory info for 32-bit execution on 64-bit hardware mode.
- Added special handling for the save/restore functions of the Wind River Diab compiler.
- Improved resolving of computed calls.
- The analyzer already knows the special-purpose registers
- SPARC:
- Improved decoder performance.
- Added support for the SPARC-V8E instructions
divsccandscan.
- SuperH: dropped support for little-endian binaries.
- TriCore:
- The syscall number has been removed for the syscall trap routines.
- Support for manual resolution of syscall targets. The analysis assumes that PSW.IS is set to 1.
- The CSA segment registers (FCXS and PCXS) are now assumed to be constant during analysis.
- The stack analysis automatically assumes a stack height of zero
after execution of a RET instruction when the following conditions are met:
- The stack height becomes unknown upon execution of the RET instruction.
- The registers PCXI and FCX have not been changed.
For example, before the change, the analyzer warned about the unknown local stack height as follows:
isa-tricore: Warning #3106: In routine 'g', at address 0x8000042e:
Routine 'g' has an unknown local height for the stack.
The global stack usage will therefore be unbounded.Now the analyzer informs about the automatically applied annotation:
isa-tricore: Info #3094: In routine 'g', at address 0x8000042e:
Automatically applied a stack height annotation of [0] bytes. - Improved switch table decoding for the Tasking compiler.
- Improved automatic decoding of GCC switch tables.
- V850: improved decoding of GHS switch tables.
- x86: improved decoding for GCC switch tables (x86-64).
Cache and pipeline analysis
- The memory map used by the pipeline analysis is now exported to the XML report file.
- ARM: improved pipeline model for Cortex-R4F and Cortex-M0 (STMF32F0DISCOVERY).
- PPC750: improved state-split handling in local worst-case computation mode.
- SPARC: improved performance and memory usage of the cache analysis.
- TriCore/AURIX: improved handling of
syscall.
Path analysis
- Improved performance and memory consumption of the ILP solver.
- The analysis now allows program exits in loops/recursions with minimal bounds.
- Improved computation of cumulative times for reporting and visualization.
- Improved handling of definitively infinite (indirect) recursions.
DWARF
- Canonicalizing C++ template arguments in the DWARF debug information and symbol table.
- Minor improvements to the DWARF reader.
- Improved reading of complex template classes.
Reporting
- The XML report now contains interval set output for value accesses/annotated areas.
- Reporting of possible function pointers now makes use of DWARF debug information to ignore data structures that are not of function pointer type. This can be disabled via Setup → Decoding → Use only safe patterns.
- Reporting and interactive output now includes information about
register-relative addressing:
instruction 0xf0000354 writes to [0xf003ff30]:4 (r1 + [0xffffffe0])
- Improved reporting of contradictions for multiple annotations of the same loop:
isa-sparc.spec: Error #11266: In "suite.ais", line 11, column 32:
In "suite.ais", line 14, column 32:
Computing restrict (640, 0x1e0): Intersection is empty.
Please correct your annotation, results may not be correct. - Annotation locations are now included in more messages, so you can find and fix wrong or incomplete annotations faster.
C++ Call Target Analyzer
The C++ Call Target Analyzer can now emit annotations to resolve virtual function calls using source code annotations.
Improved performance
- Significantly faster trace parsing.
- The trace conversion step is now combined with trace path analysis step to avoid writing large intermediate trace files. This speeds up TimeWeaver analyses in general.
- The value analysis phase can now be disabled globally for all TimeWeaver analyses under Setup → Timing analysis → TimeWeaver → Perform value analysis. This allows for a much faster analysis.
Reduced memory consumption
- Trace snippet endings are now reported summed up in a single message. Likewise for skipped trace snippets. This reduces the size of the report file, as well as the memory consumption of the GUI.
- Reduced memory consumption of trace path analysis.
- Trace statistics per trace segment can now be disabled or limited to a specific amount of occurrences to further reduce the memory consumption.
GUI
- Trace files are now configured globally under Setup → Files.
- Improved trace coverage statistic for infeasible routines.
- New special kind of analysis dependency that allows TimeWeaver analyses to re-use extracted traces snippets for subsequent analysis for the same entry point. This can be used to more quickly perform TimeWeaver analyses for different task modes.
PowerPC BHM traces
Improved handling of external routines.
Other improvements
- Trace snippet statistics now only consider interrupts that return to the original control flow.
- Global symbol table entries can now be filtered by entries that are reachable by the given trace files.