Improved GUI
This release features several subtle yet useful improvements to the graphical user interface.
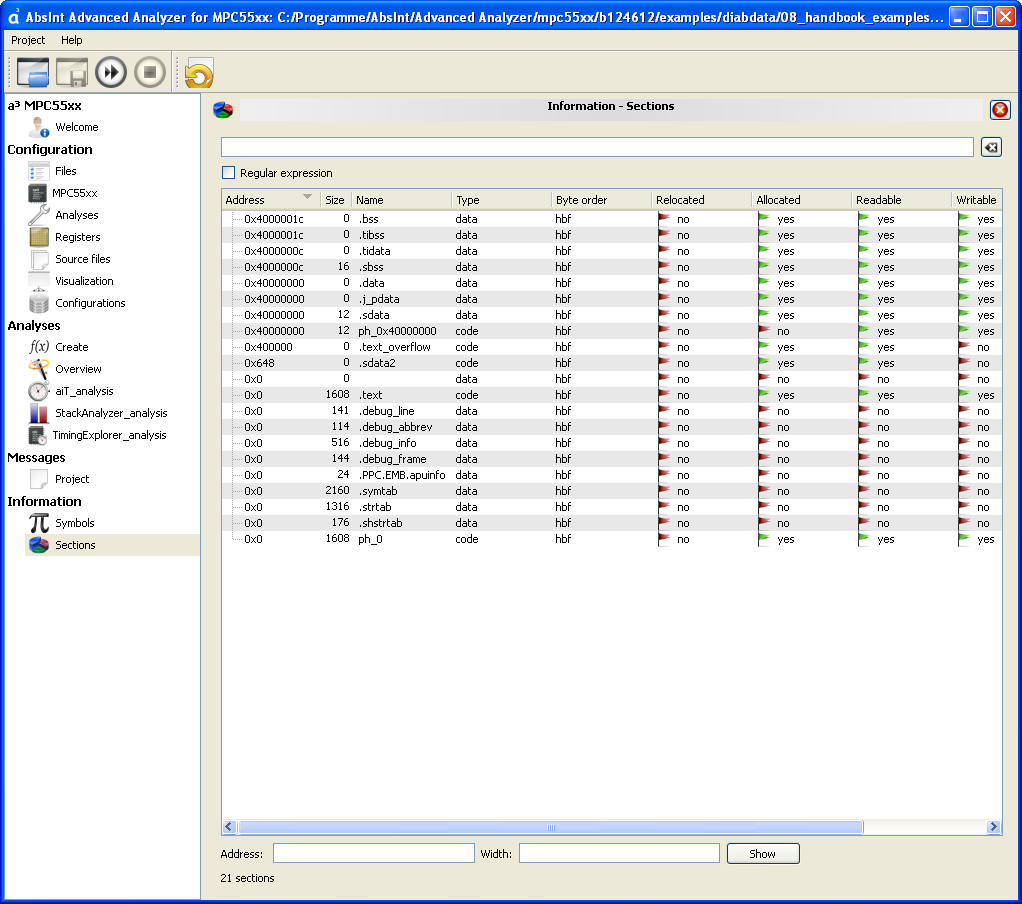
New “Sections” view
This feature allows to view all sections of the binary and inspect their content like in a hex editor. It also allows to show the memory content for a given address area.
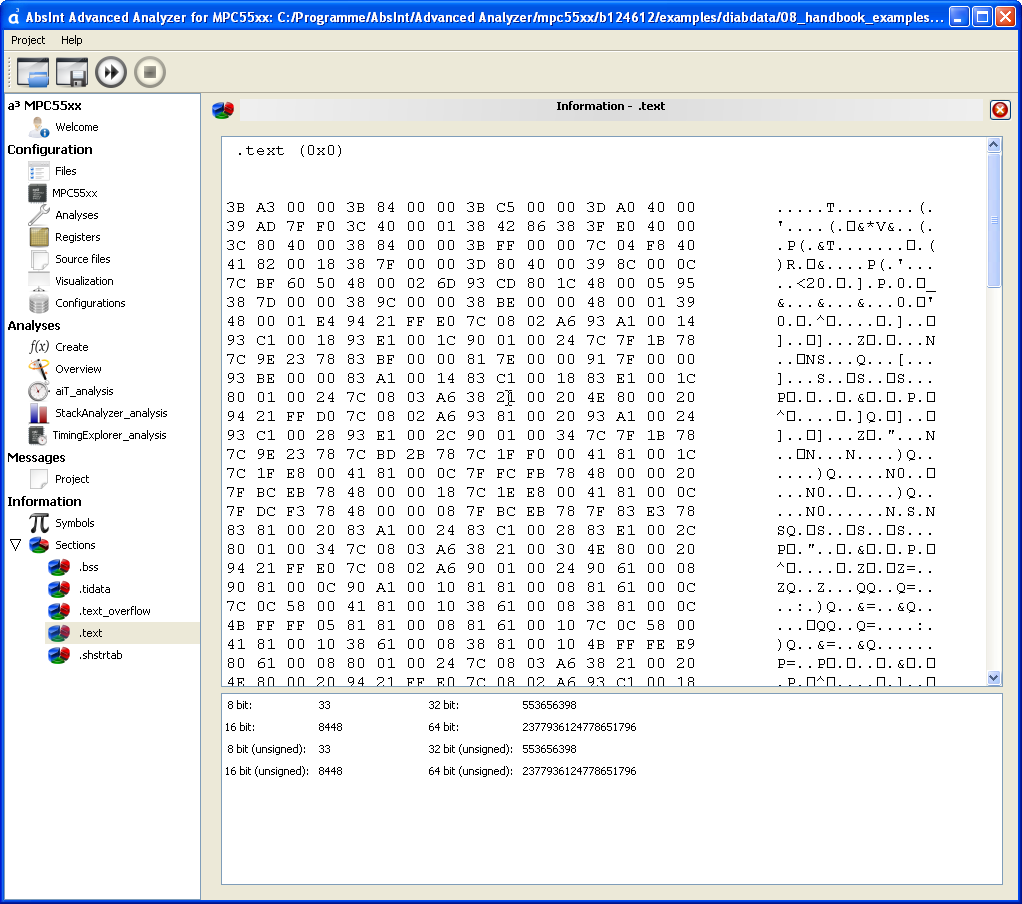
Double-clicking on a section reveals its content
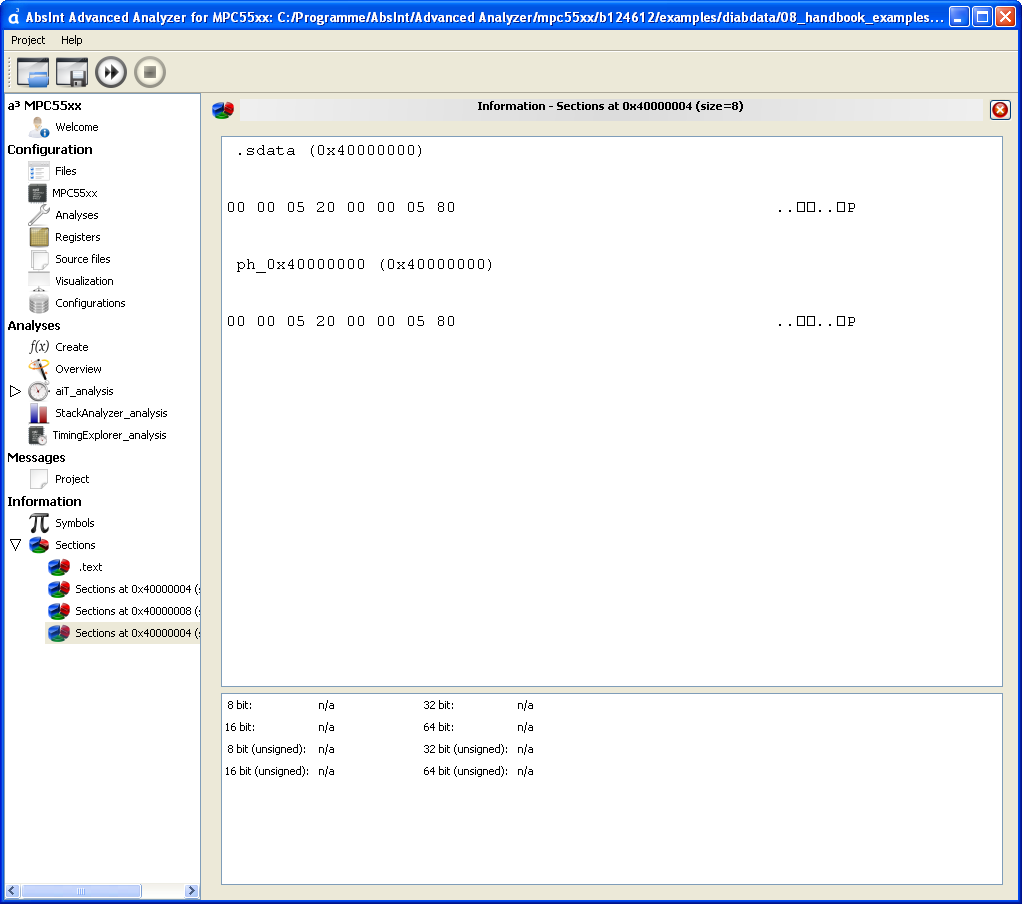
Viewing 8 bytes of data at address 0x40000004
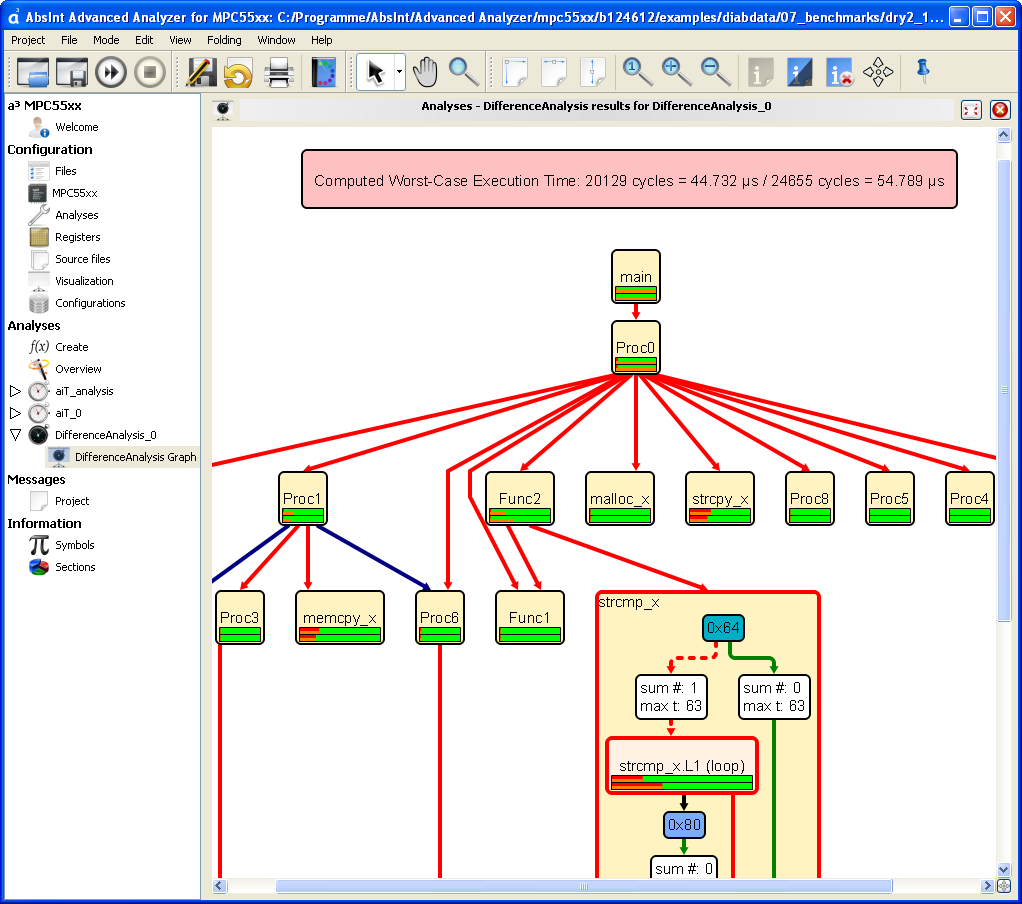
Difference analysis
This experimental feature allows to graphically compare two WCET analysis graphs starting at the same entry point. This is especially helpful for comparing different analysis setups (different annotations, hardware settings, etc.).
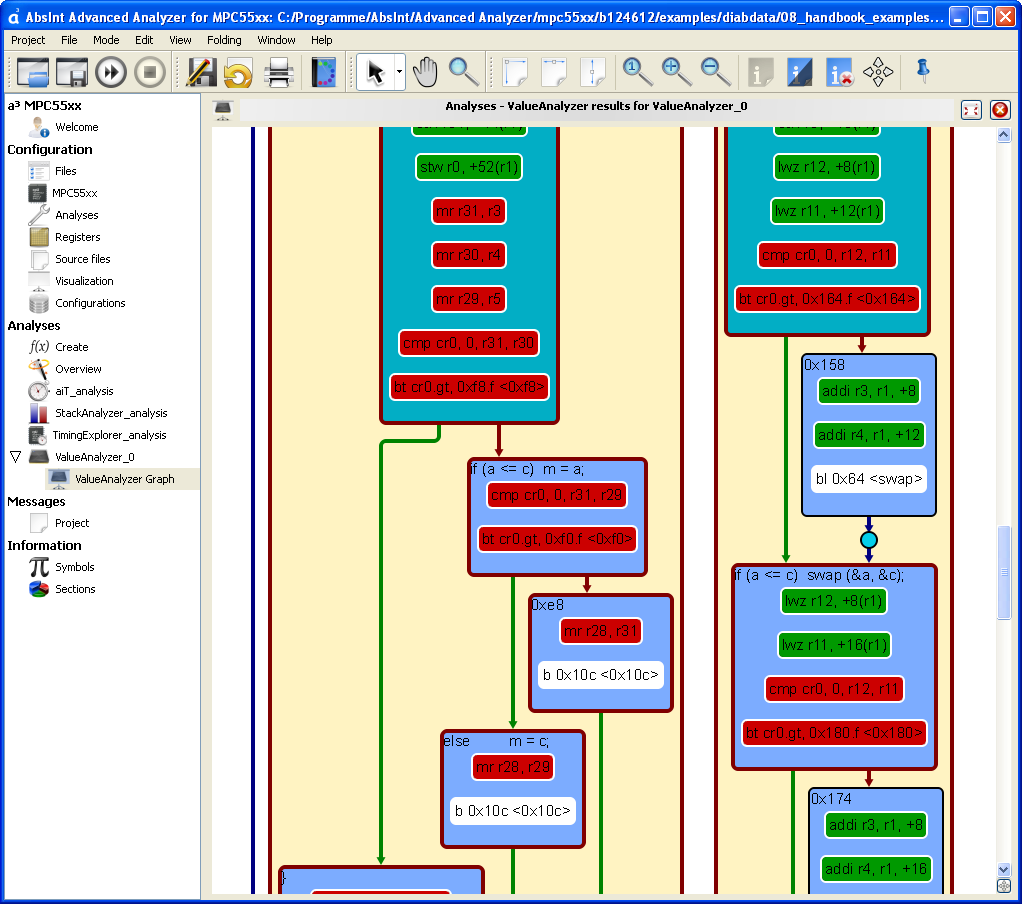
Enhanced visualization of PowerPC value analysis results
The value analysis for PowerPC now allows to visualize the quality of its results. This is done by coloring instructions in the control-flow graph according to the precision of the obtained results.
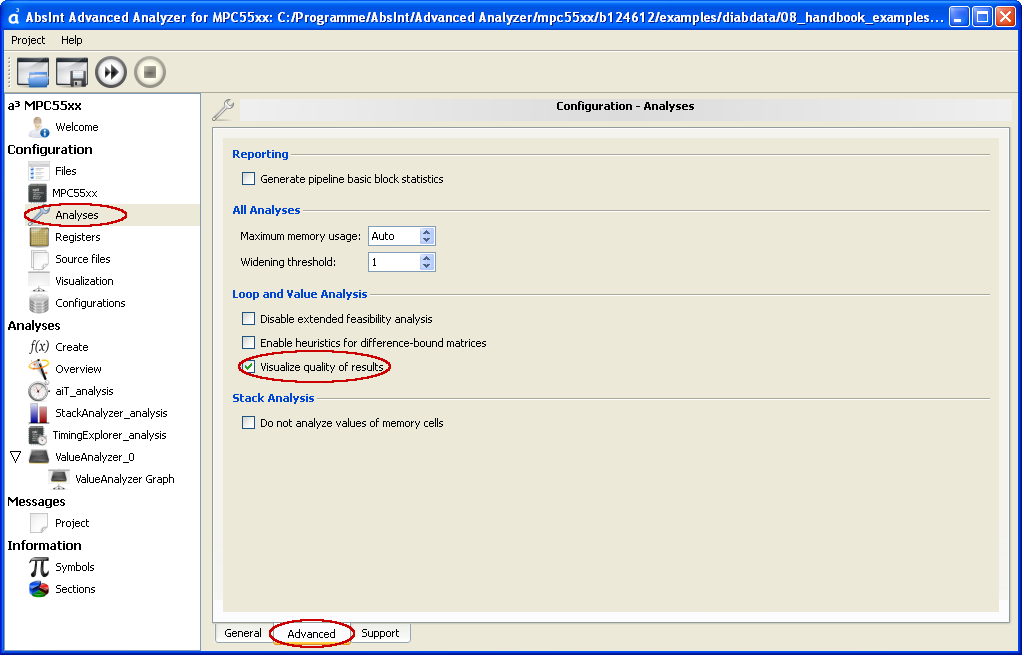
This feature can be enabled under “Configuration” → “Analyses” → “Advanced” → “Visualize quality of results” (see screenshot).
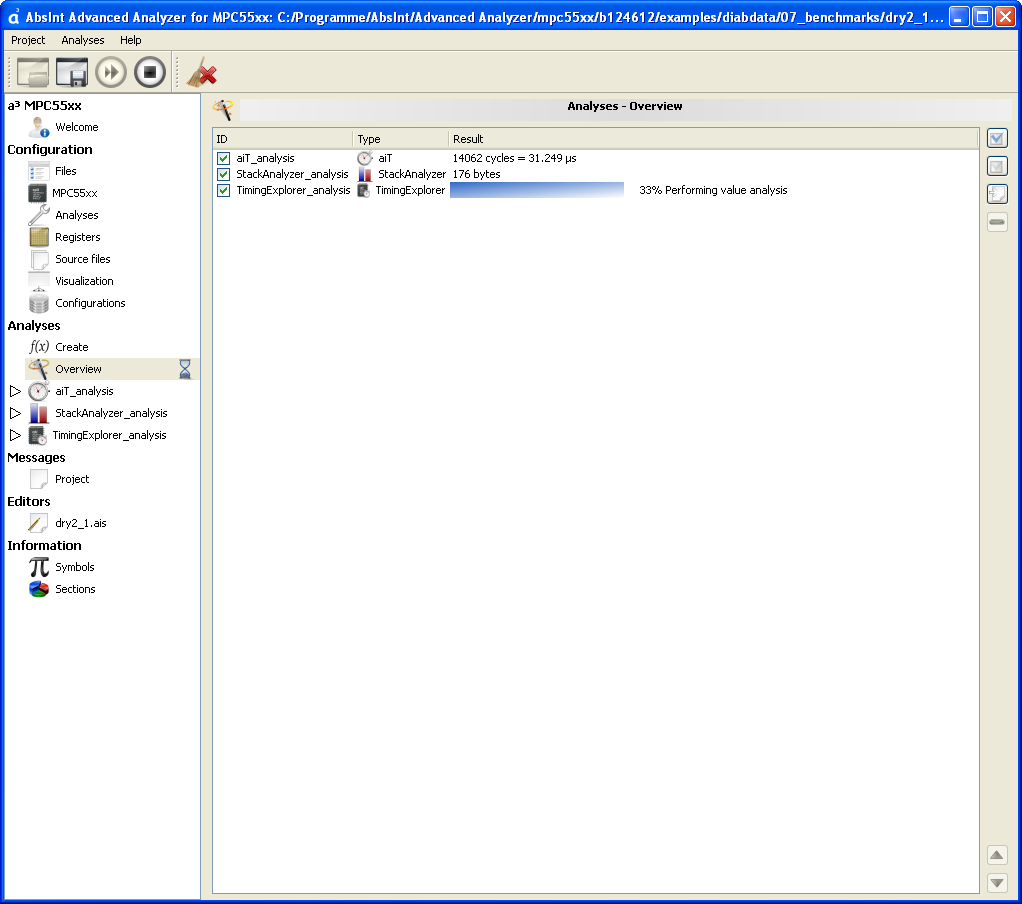
Improved analyses overview
The results view has been merged into the analyses overview. Progress and results for all analyses are now shown on the same page. Sorting and deletion of analyses have been improved as well as the general performance of the a³ GUI for projects with a multitude of analyses. a³ also no longer forgets existing analyses results after a new analysis is added.
Result graphs are no longer opened automatically after running an analysis. To open the result graph for a particular analysis, double-click on the corresponding row in the analyses overview.
a³ now also ensures that only up-to-date result graphs are shown. If a graph has changed, its latest version will be loaded automatically.
Configuration import wizard
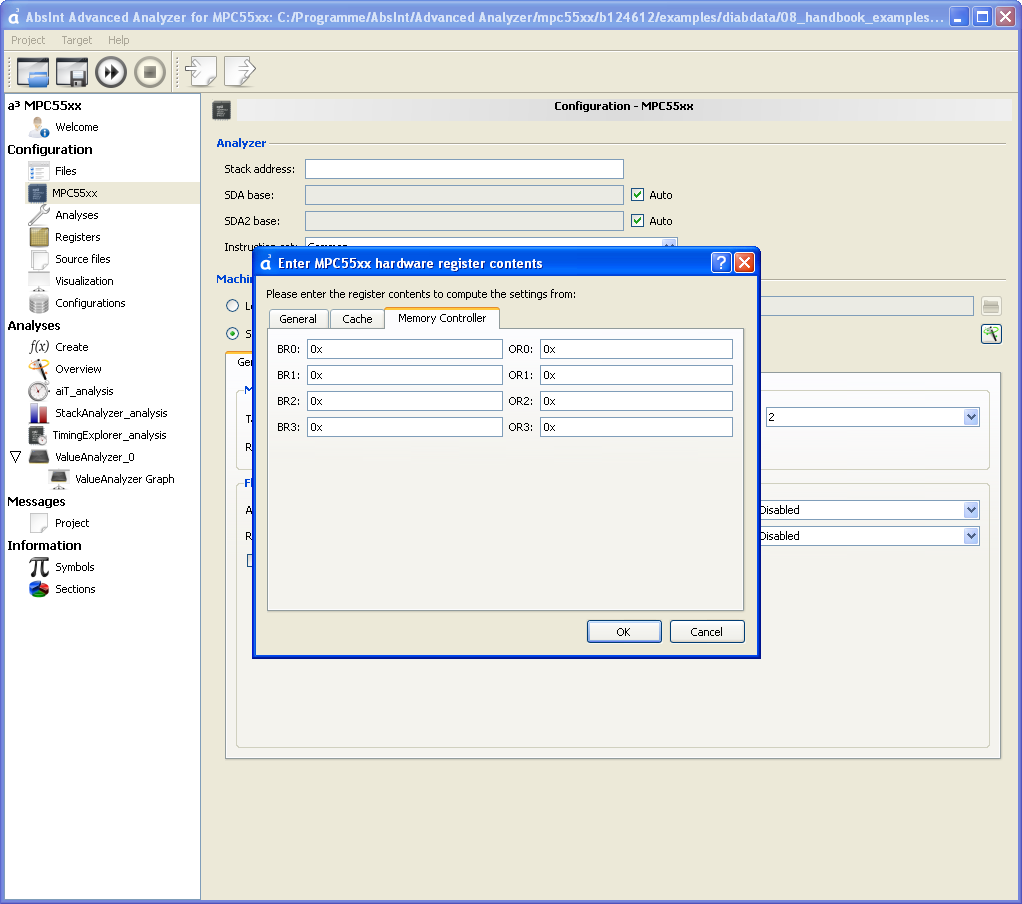
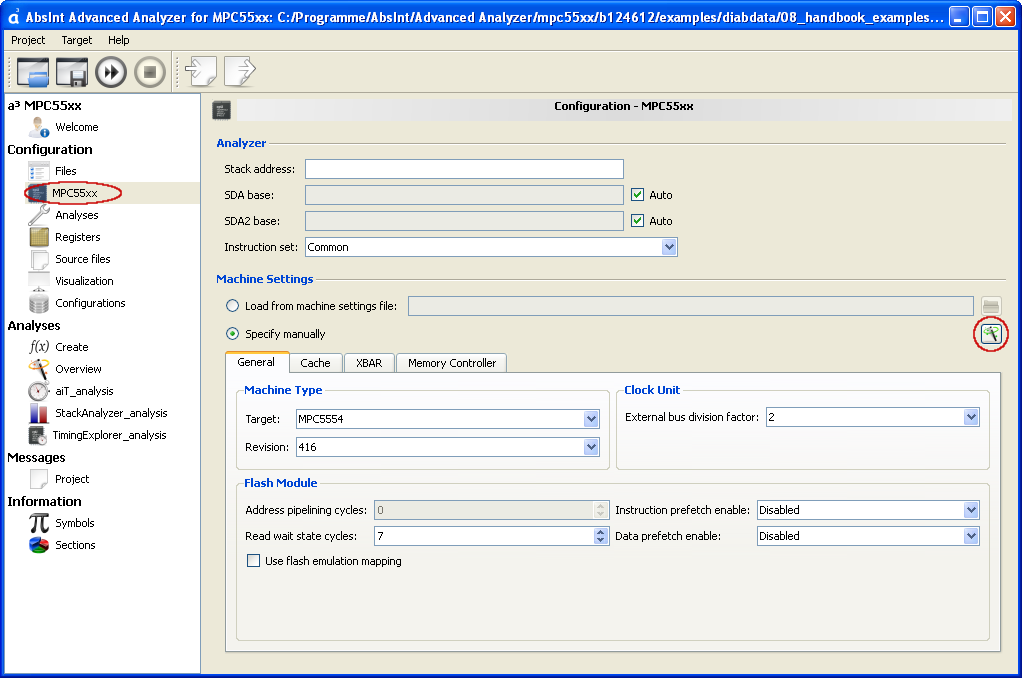
a³ for MPC55xx, MPC5xx, and TriCore now supports importing a target/memory configuration from system register contents.
This feature is accessible via “Configuration” → “Processor name” → “Machine Settings” → magic wand button “Specify settings via register values” (see screenshot).
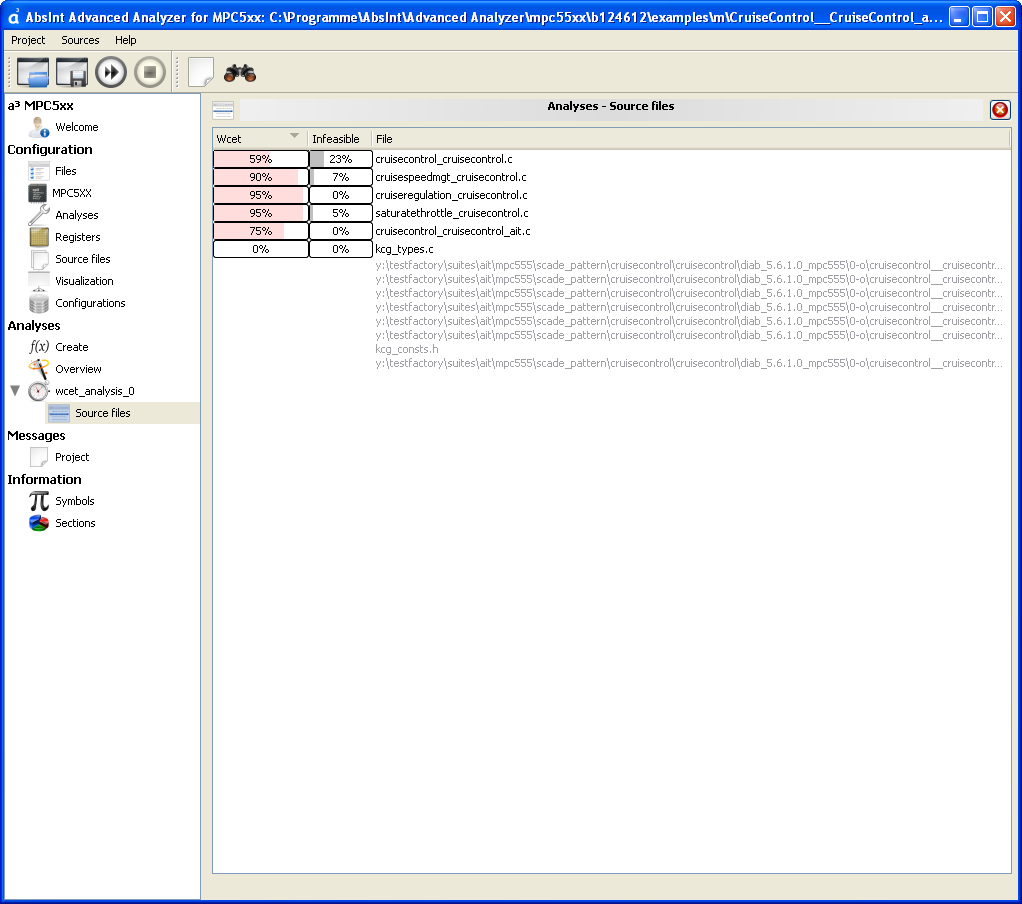
Code percentages
The percentage of infeasible code and code that lies on the WCET path is now calculated in the source-files view.
Code highlighting
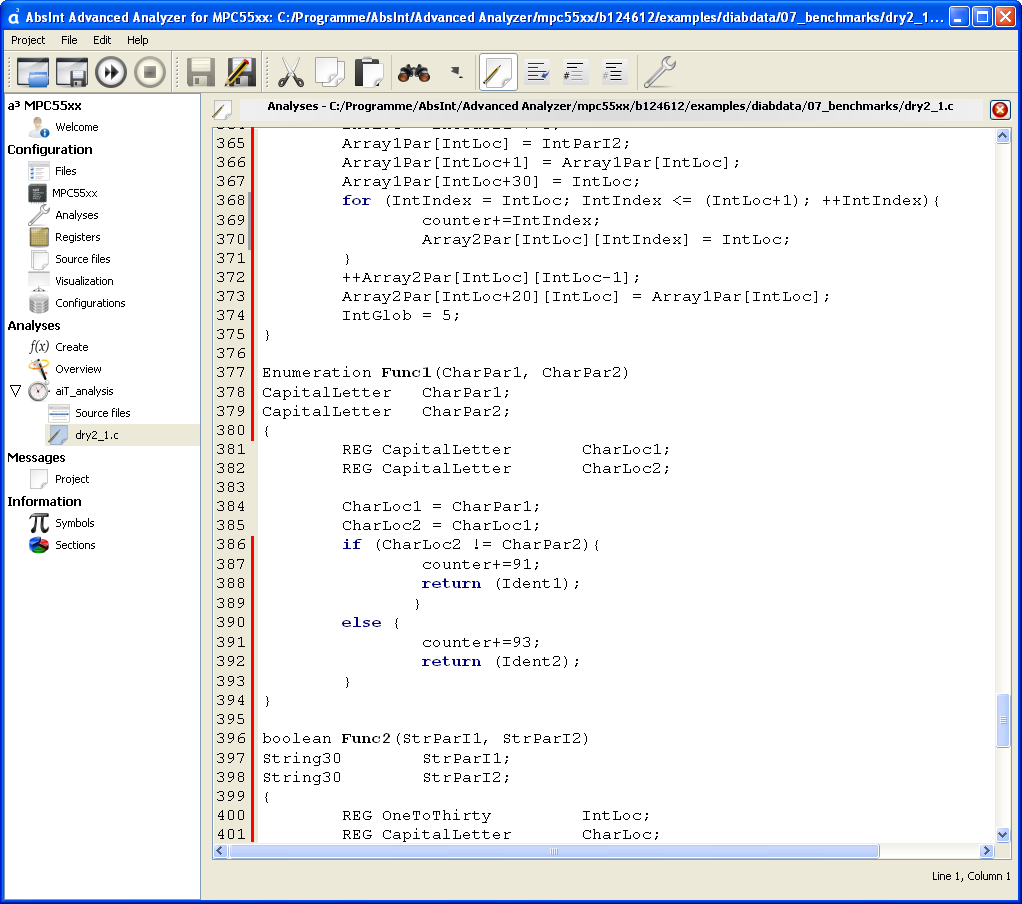
For both stack-usage and WCET analysis, code sections that lie on the worst-case path are now marked red in the source-code and disassembly view. Infeasible parts of the analyzed program are now grayed out in the resulting graphs and the disassembly view.
In the source-code view, infeasible code and code that lies on the worst-case path is marked by a colored margin rather than by a colored background. Thus, if a line contains both infeasible code and code that contributes to the WCET, it will have two margins of different colors.
The disassembly view now also features syntax highlighting.
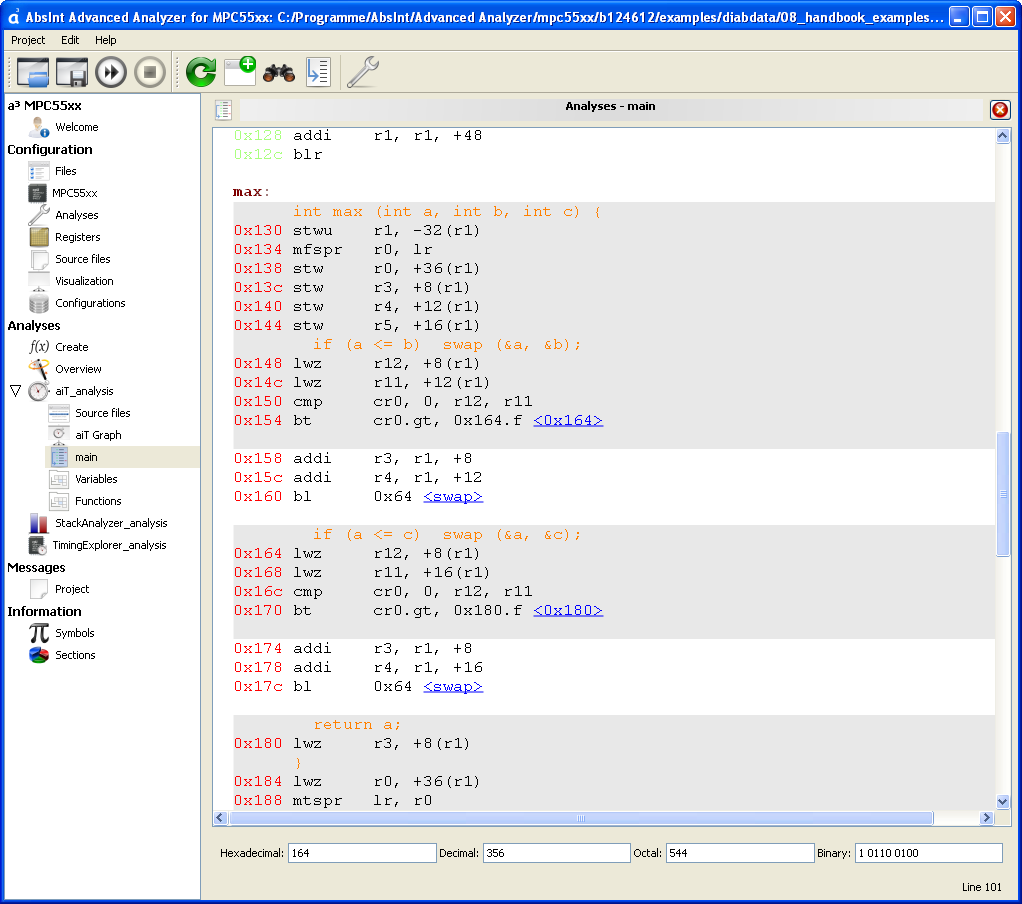
Grayed-out code and syntax highlighting in the disassembly window
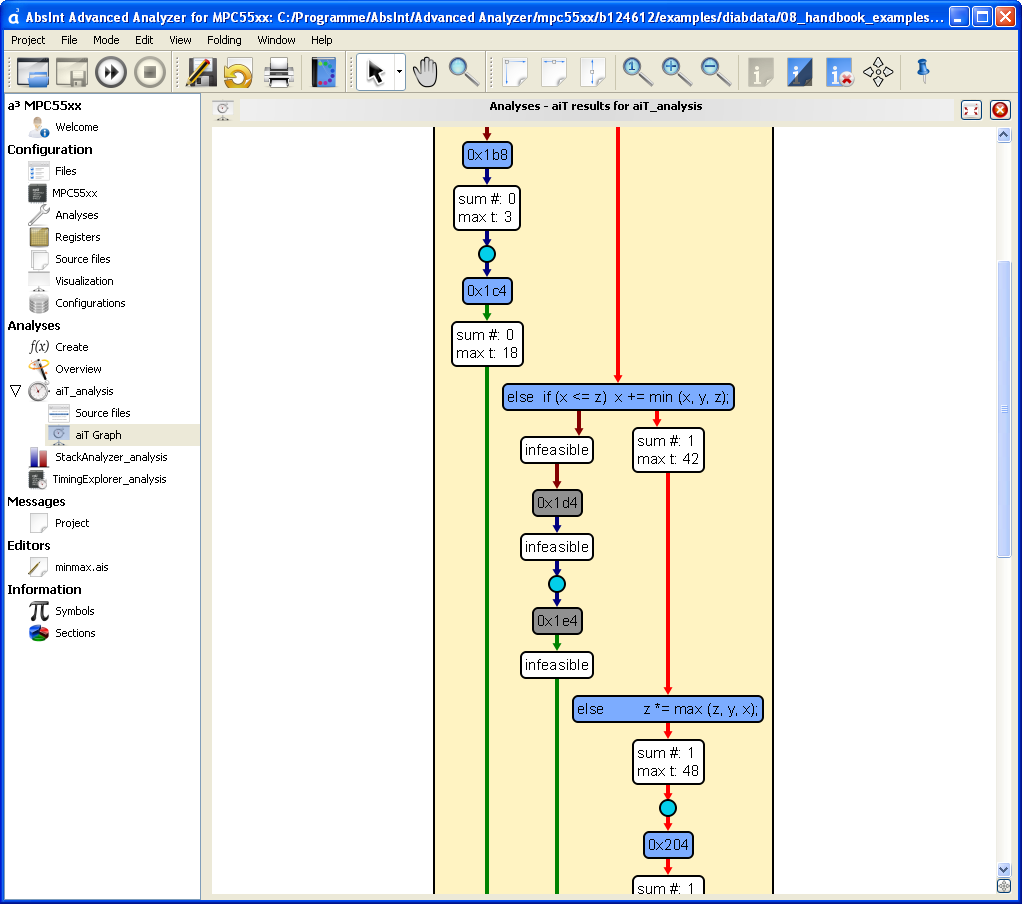
Grayed-out part in the control flow graph
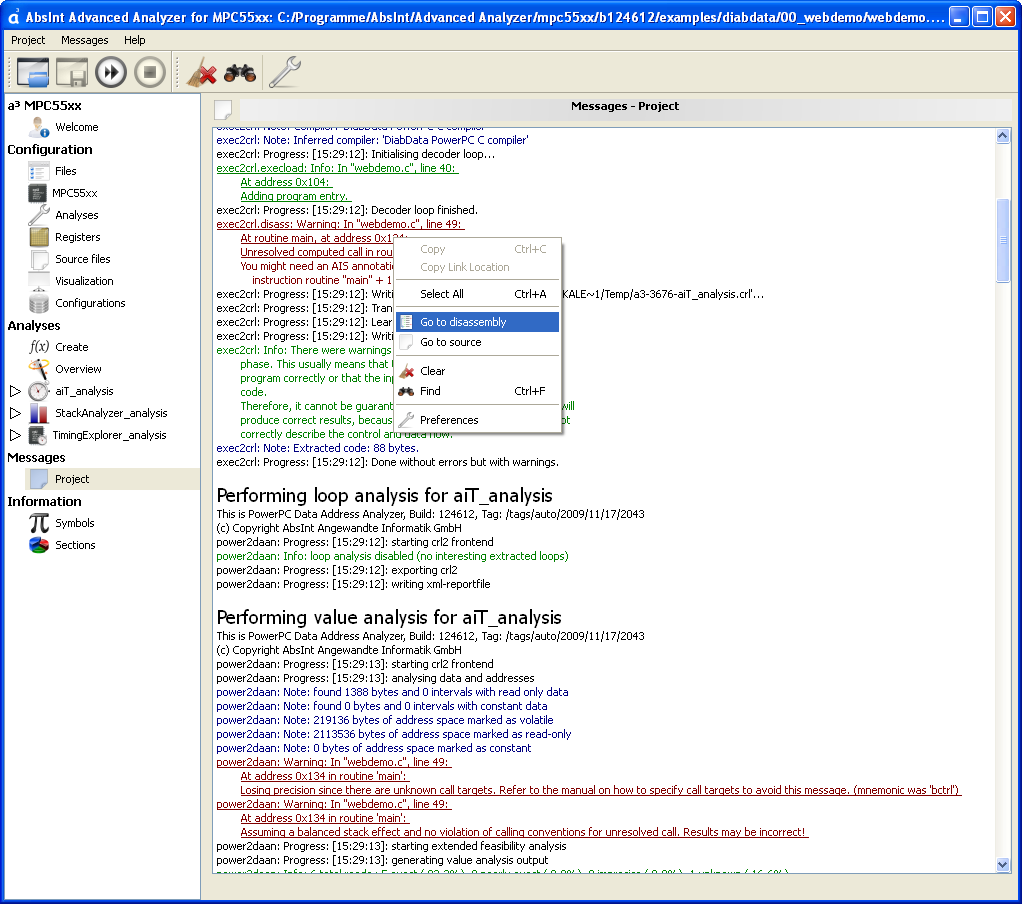
Links from messages to disassembly
For messages that have address information, one can jump to the corresponding address in the disassembly by selecting “Go to disassembly” from the context menu. The executable must have been disassembled via “Analysis” → “Disassembly” in order for this feature to work.
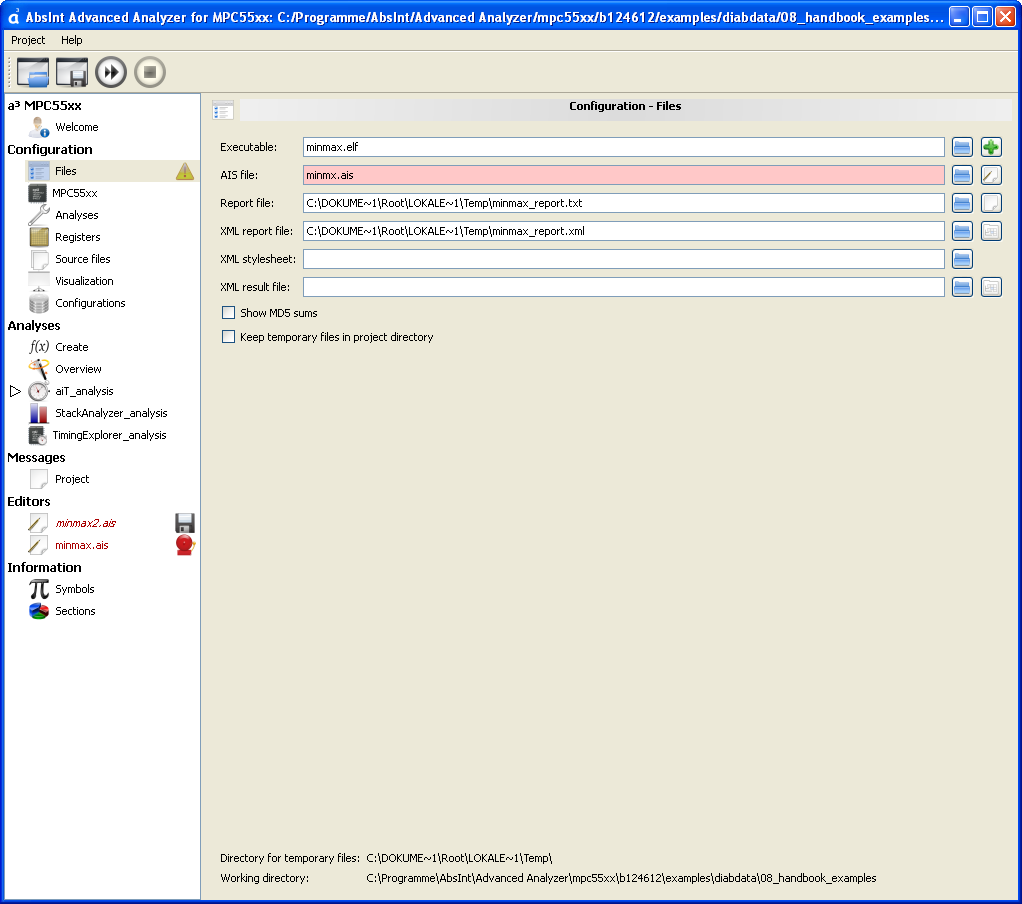
Missing input files
Improved validation whether all input files needed for the analysis are available. The user is notified about missing files via red input field background and symbols in the navigation bar.
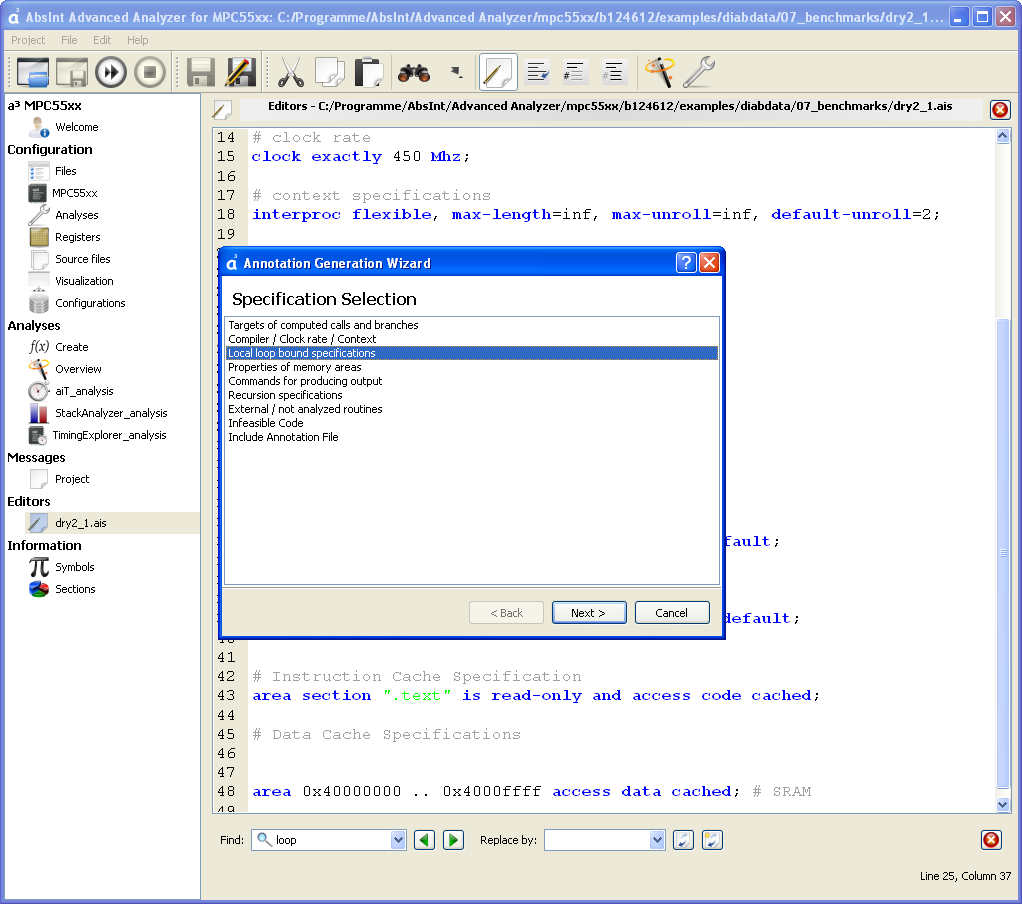
Improved AIS Wizard
The AIS Wizard now supports more annotations and paged architectures. The Wizard can be invoked in the editor context menu or in the “Edit” menu.
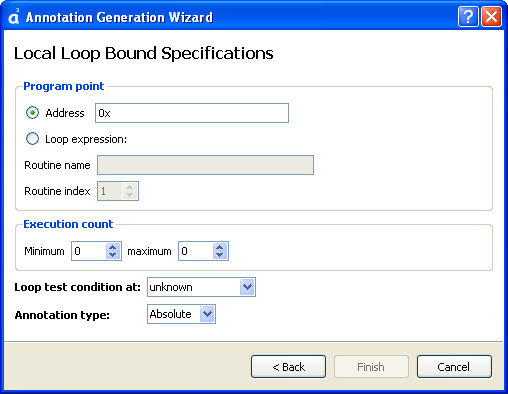
Local loop bound specifications
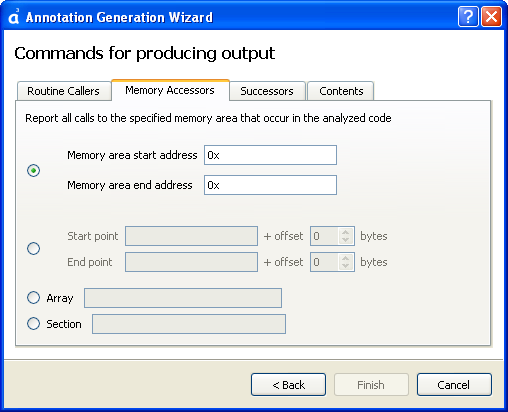
Memory accessors