New target
aiT WCET Analyzer is now available for MPC5777C.
Improved workspaces

- Workspaces can now be saved even while analyses are still running, so you can store partial results of the already finished ones.
- The extension
.apzis now used for workspaces to distinguish them from normal.apxproject files. - Workspace APZ files are movable, i.e. the file names within a workspace are now relative to the location of the workspace as a whole.
General improvements
- The pipeline and path analysis phases have been combined for better performance.
This results in new configuration values for the “Path analysis variant”:
- Auto
- Basic block level
- Pipeline state level
The new default is "Auto", which heuristically decides whether the more precise Pipeline state level is feasible or not. Explicitly specifying the desired level overrules the heuristics.
- The current status of the ALM server in XML format can now be accessed by appending
/?xmlto the URL:http://<your license server name>:42425/?xml
- Improved ORTI importer by always attempting to lookup entry points via symbol table if lookup via RUNNINGTASK enum attribute doesn't work.
- Improved rendering of the online-help PDF viewer.
Improved DWARF handling
- Improved reading of DWARFv2 and C++ DWARF debug information.
- Improved handling of source-code information from DWARF.
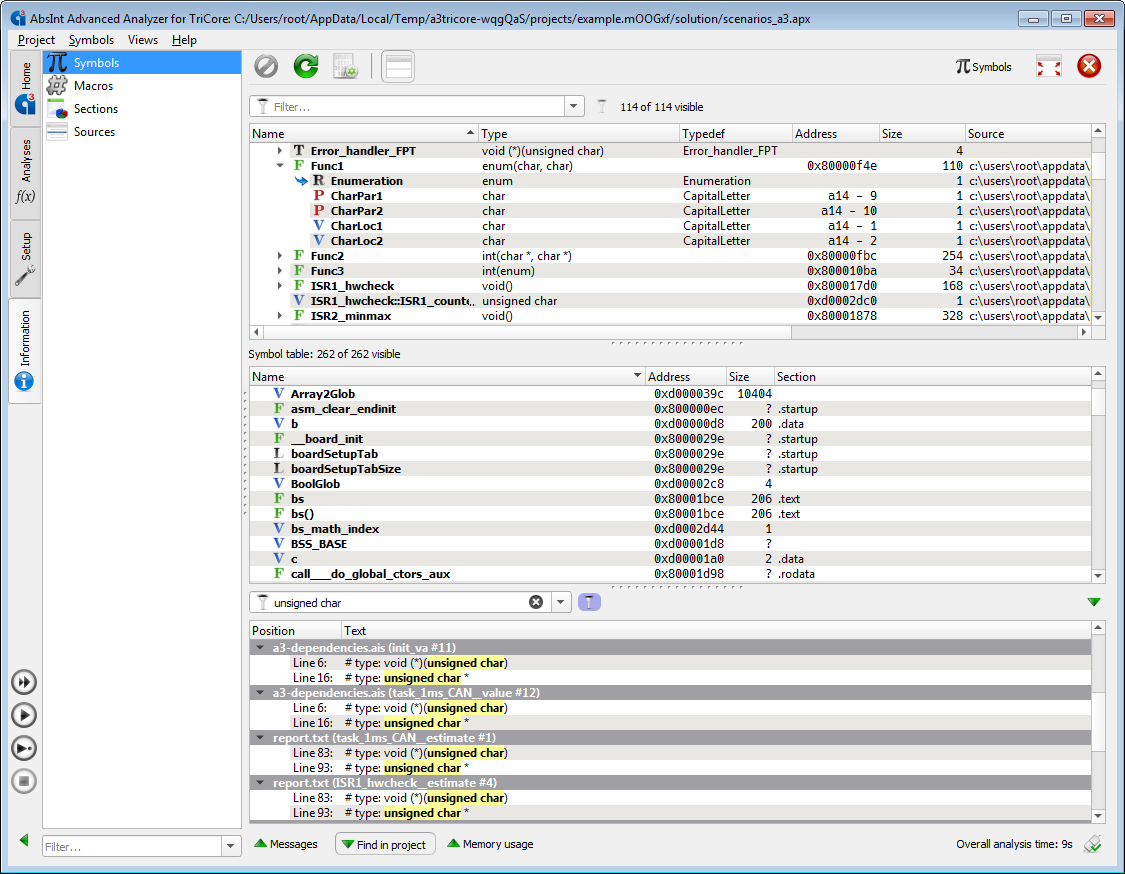
- The DWARF view has been fully merged into the Symbols view.
- The search limits in the new Symbols view have been increased to make DWARF search results available earlier.
- Iterative decoding now uses the DWARF debug information
to improve automatic decoding of C++ virtual member function calls.
- Function-local static variables are no longer considered for extracting constant memory regions from DWARF.
- The option Setup → “Source files” → “Strip compilation path” to strip the compilation path mentioned in the DWARF debug information is now enabled by default.
- Improved handling of DWARFv2 generated by the GHS compiler.
Qualification Support Kits

- New compiler-specific QSKs for:
- aiT for ARM with TI 20.2.1.LTS
- aiT for e200 with GHS 2019.1.4
- StackAnalyzer for C16x with Tasking VX 3.1r2
- New board-specific QSKs for:
- aiT for tms570lc4357
- aiT for MPC5777C
- Improvements:
- Increased mapping parameters (max length and default unroll) for compiler-specific test cases.
- Enhanced error messaging for test run specification errors (.config files).
- Renamed outdated term "Revision" for baseline information on title page of TOR/VTP documents to "Build".
- Update
qk_ais2_wcet_code_snippetsto cover new variant of code snippet annotations. - Update
qk_ais2_program_point_base_sourceto cover usage of match functor inside program point base specifications. - Update
qk_ais2_area_definitions_simpleto cover usage of match functor inside section() functor for area construction. - Update
qk_ais2_expression_enum_valuesto cover all possible usages of the enumerator values.
- New test cases:
qk_ais2_no_value_token_allocation all architectures qk_ais2_allow_decoder_to_read_from_writable_memory all except dsPIC qk_ais2_routine_snippet_timing
qk_setting_output_variable_usage_statistics
qk_setting_output_object_size_statisticsall WCET - Known issue: The Software Verification Results document (part of QSLCD) is currently contained in the QSK product archive and not in the special SVR product archive.
GUI
- For the analysis overview under Home → Overview, you can now configure what columns it should display.
- The expected result field now supports AIS expressions.
- New default font for text editors and graphs.
- Improved search performance in text editor views.
- Interactive analyses are now automatically terminated when the associated analysis is removed from the project.
- The Memory Usage view now displays two different memory sizes:

- “Resident”, which is the usage of actual physical RAM
- “Virtual”, which is just the mapped stuff and things in swap
- The analysis concurrency level can now be changed during analysis, by right-clicking on the progress bar at the bottom of the main window.
- “Find in symbols” now switches to the configuration of the analysis in the Symbols view.
- Edit analyses dialog now allows more options.
- The option Setup → Source files → “Strip compilation path” to strip the compilation path mentioned in the DWARF debug information is now enabled by default.
- Function-local static variables are no longer considered for Setup → Decoding → “DWARF Debug Information” → “Extract constant memory regions”.
- Improved handling for 64-bit values for configured (stack) register(s) and stack area.
- Improved visualization of collapsed analyses items.
- Workspaces can now be saved even while analyses are still running, so you can store partial results of the already finished ones.
Visualization and results
- Restructured context menu in Graph view.

- Infeasible callers and call targets in the context menu are now marked by the suffix “(infeasible)”.
- Call nodes of trampoline routines are now shown in the call graph.
- Annotation hints are now also included in the “Copy AIS annotations” menu.
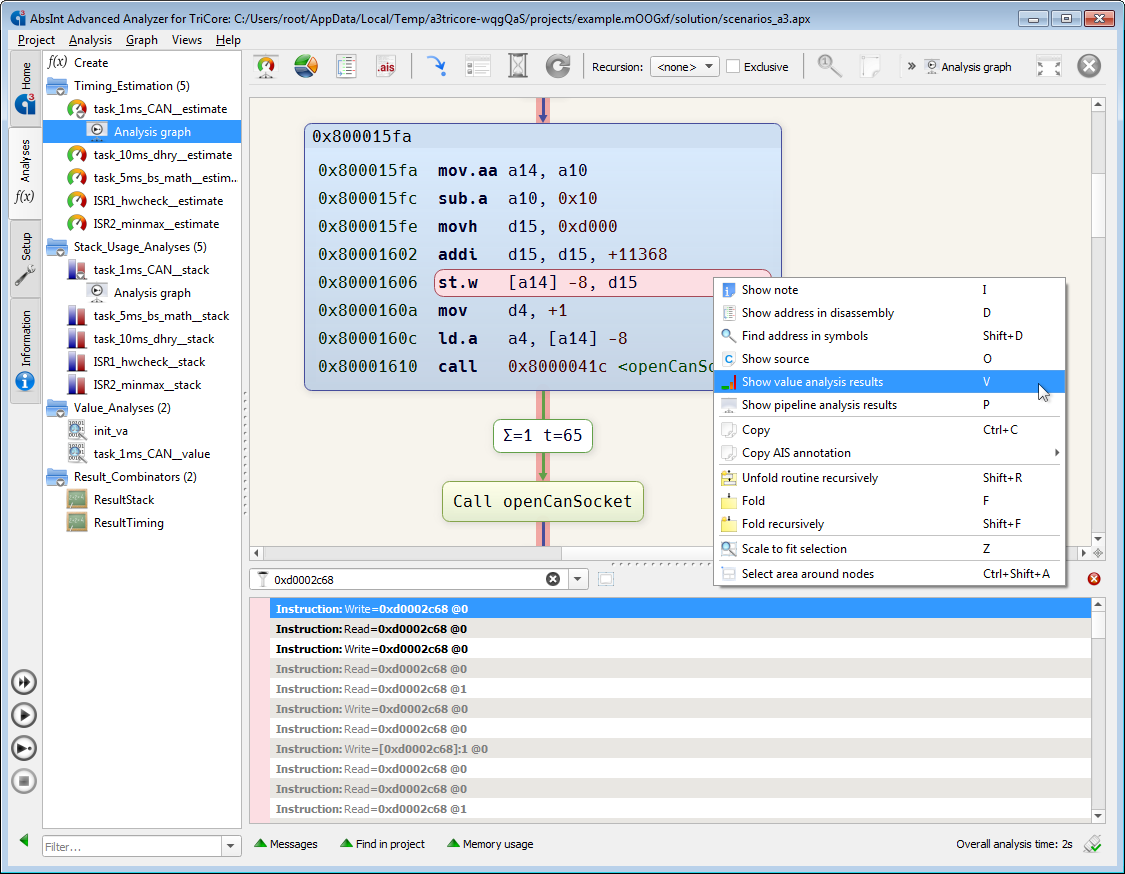
- From graph search for memory reads/writes it is now possible to jump from the search results to interactive VA via context menu.
- XML result file warning/error counters are now kept for all analyses, even if not all of them are re-run.
- Variable usage statistics will allow non-allocated objects to be counted, too, if no allocated objects are found for an access.
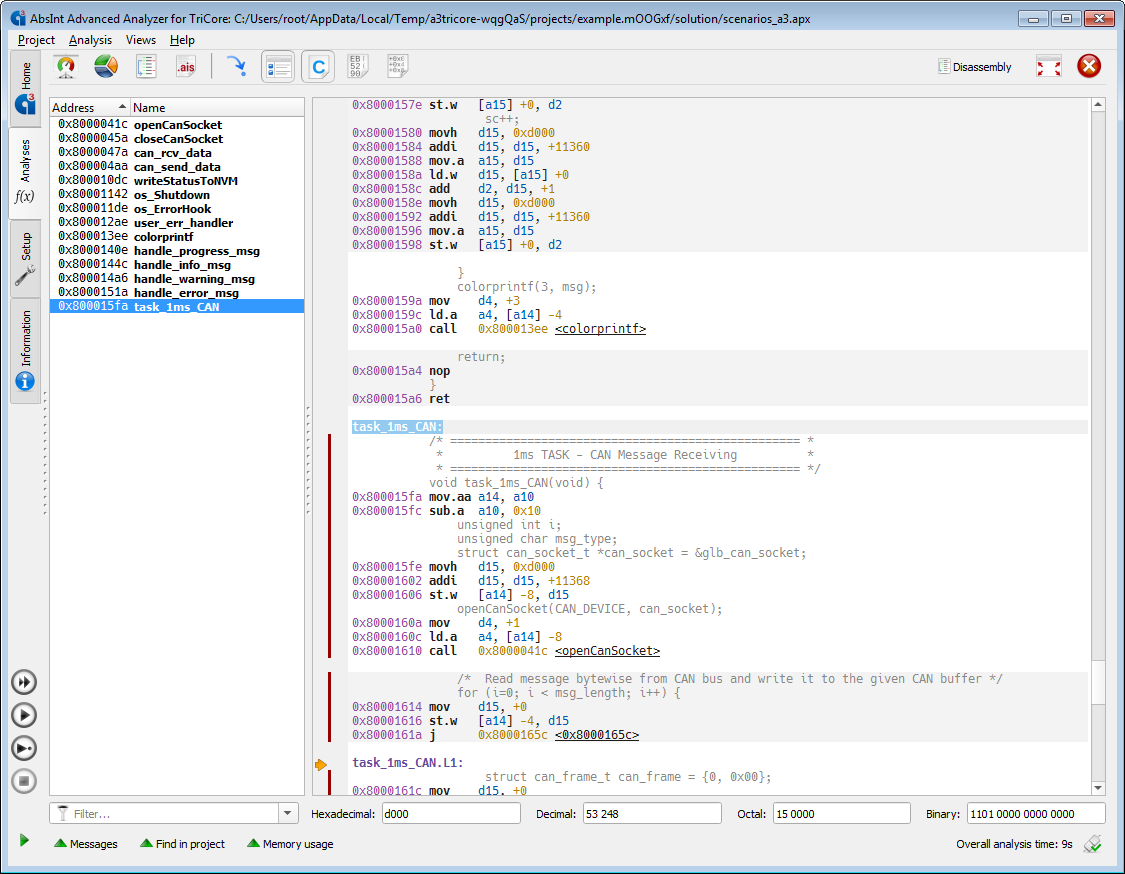
- Completely revamped Disassembly view.
Information
- The Symbols view now unites the information from DWARF and the symbol table.
- Increased search limits in DWARF view to make full search results available earlier.
- Improved handling of non-byte addresses in the Sections view.
TriCore
The GUI now automatically annotates the base address of the core special function register (CSFR) depending on the selected core.
Annotations
- AIS files are no longer required to have the file name suffix
.ais. - AIS1 annotations are no longer supported.
- Improved performance and reduced memory consumption of AIS2 expression resolver.
- New annotation for initialization analysis to not collect all seen values
for a variable but dump the values seen at some program point for the given variables:
routine "init" dump: "msg_length"
instruction "init" -> write(3) dump: "can_msg_buffer";
See the user manual for more details. - New annotation
preserves: stack;. See the user manual for details. - New area attribute for specifying if the decoder is allowed
to read the contents of writable sections.
attribute "allow_decoder_to_read_from_writable_memory": false|true;
- Improvement to collect initialization analysis. If the initialization task itself
needs some of the collected information, the new annotation
iterative collect initialization;
allows to enable an iterative collect analysis that will use the collected content it produces itself during the iterative decoding phase. This allows e.g. to collect function pointers to further init functions that are later used by theinitfunction itself to trigger more initialization code. - Extended the
enumfunctor to allow for lookup via enum types and regular expressions:# lookup by enumerator name enum("<name>") # lookup by enumerator name regex enum(match("<name_regex>")) # lookup by enum type name enum(type("<type>")) # lookup by enum type name regex enum(type(match("<type_regex>"))) # lookup by enumerator name and enum type name enum("<name>", type("<type>")) # lookup by enumerator name regex and enum type name enum(match("<name_regex>"), type("<type>")) # lookup by enumerator name and enum type name regex enum("<name>", type(match("<type_regex>"))) # lookup by enumerator name regex and enum type name regex enum(match("<name_regex>"), type(match("<type_regex>"))) - The mapping parameters "max length" and "max unroll" can now handle
expressions that evaluate to intervals or sets of values.
In that case the effective parameter value will implicitly be the maximum. Example:
max length: [3, inf];
yields a resulting maximum call string length of inf , i.e., unbounded.default unroll: -5..8;
yields an upper bound for the number of individual loop contexts of 8. - Improved handling of "instruction <pp> returns to: ...;" annotation in the presence of a "instruction <pp> target not analyzed;" annotation for the same program point <pp>.
- Improved handling for sets of values in mem functor and array program point specification.
Decoding
- C++ virtual member functions can now be resolved automatically
by the iterative decoding. Using DWARF debug information, the value analysis keeps
track of potential class types to allow the decoder to determine the called
virtual member functions.
Currently supported architectures are: ARM (thumb, arm, aarch64), PowerPC, RISC-V, SPARC, V850, and TriCore. - Virtual member function program point specifications
now resolve by reading the associated
vtablecontents. - Improved function type signature verification of call targets.
- Improved annotations hints for accesses to writable/volatile memory to be more symbolic.
In other words, instead of something like
area 0x9004aa44 width 4 { volatile: true; }the hints will now say something likearea ("MemoryBlockInfo"."HandlerFunction_pt") { volatile: true; } - Allocated sections that contain no data will be handled like not allocated sections.
- Improved handling of:
- non-quanta dividable sections sizes in binaries
- computed calls where some call targets never return and others return normally
- suppress message when attached to routine scopes
- Improved resolving of computed calls in general.
- Function-local static variables are no longer considered for Setup → Decoding → “DWARF Debug Information” → “Extract constant memory regions”.
Control-flow, stack, and value analysis
- Greatly improved stack analysis runtime for highly recursive programs.

- ARM:
- Improved stack analysis for programs using a frame pointer.
- The svc trap instruction will call the trap routine “svc”. Previous versions used “swi0x...” as the name for this.
- AArch64: Improved decoding for GHS switch tables.
- C16x: Improved handling of TASKING code optimizations.
- PowerPC: Improved DiabData switch table decoding.
- SPARC:
- Improved iterative decoding
- Improved decoding of JMPL+RETT pairs
- Improved register dependency handling for save/restore/rett
- TriCore:
- The analyzer now automatically applies a stack-height annotation if
PSW.ISis zero and the target ofSYSCALL/TRAPSV/TRAPVis external, in order to prevent an unknown user stack result due to the switch to interrupt stack. Example:isa-tricore: Info #3080: In routine 'test_trap', at address 0x80005918:
The relative stack height becomes unknown.
The value analysis results might be imprecise.
Annotation proposal:
instruction "test_trap" -> computed(2) { stack effect: <int> bytes; }isa-tricore: Info #3094: In routine 'test_trap', at address 0x80005918:
Automatically applied a stack height annotation of [8] bytes. - The decoder can now automatically resolve syscalls and overflow traps if the user specifies the Base Trap Vector Table Pointer (BTV) in the hardware configuration of the UI.
- Allow manual and automatic resolution for software traps
(class 5 and 6 traps) caused by the instructions
SYSCALL,TRAPSV,TRAPVindependently of the value ofPSW.IS. - Improved modelling of free list update during CSA restore.
- Improved handling of TriCore calling conventions
- Improved automatic stack height annotations.
- The registers
PSW.PRS,PSW.S,PSW.FX,PSW.CDE,PSW.CDC,PCXI.PCPN,PCXI.PIE,PCXI.UL, and ICR are not explicitly modelled. They behave as if they always contain an unknown value. - Improved guessing of CSA base address. The analysis assumes that at least one CSA is used for the outermost call or trap.
- Virtual trap routines “trapv” and “trapsv” are used as targets
of instruction
trapvandtrapsvif the target is not explicitly resolved - Improved switch table decoding for the Tasking compiler
- Improved switch table and call table decoding for GCC
- The analyzer now automatically applies a stack-height annotation if
- RH850/V850:
- Improved analysis precision for the registers
EIWRandFEWR - Improved handling of the instruction
STC.Wduring value analysis - Improved GHS switch table decoding
- Improved analysis precision for the registers
Value analysis
- The register-relative memory info is now sharpened for conditional branches, too. Contradictions between absolute and relative memory info that were previously reported as errors are now output as normal information messages, since they are now likely to be emitted for infeasible branches.
- Improved memory usage for analyses that use larger value set sizes.
- Improved both the analysis performance and the precision for branch splitting.
- Optimized tracking of register relations over function calls.
- Improved precision for:
- writes to registers that have sub-registers
- multiplication of the same register/memory cell
- analyses with short call strings
- pointer alignment operations
- interval intersection
- "collect initialization"
- register-relative memory analysis
- bit-wise
andoperations if value sets are enabled - register tainting
- Further improved precision by allowing higher value set size limits, e.g. for resolving computed control flow and loading constant/read-only memory content.
- Output statistics about the distribution of analysis iterations over the analyzed routines.
This allows to see in which routines most analysis runtime is approximately spend.
isa-c16x: Info: Value analyzer iteration statistics (percent of processed nodes * contexts / routine): 29% of iteration in '__flsbuf' 10% of iteration in '_inSet' 10% of iteration in '_UpSet.L1' 7% of iteration in '_addSet' 7% of iteration in '_putSet.L2' 5% of iteration in '_cleanup.L1' - Reduced loss of information during widening phase.
- Improved handling of memory tainting.
- Register taint information is used to keep more relational info over function calls.
Cache and pipeline analysis
- Am486: Improved pipeline model.
- ARM:
- Cortex-R5F: Improved stability of value partitioning. This improves the pipeline state filtering that in earlier versions could lead to an error message during the pipeline analysis phase.
- LH79520 (ARM720T): Higher precision for code executed from external memory.
- Improved handling of BKPT, SEV, SVC, WFE, WFI instructions for Cortex-M0, Cortex-M1, Cortex-M3 and Cortex-M4 pipeline analyses.
- C16x: Improved timing model for c166sv2 pipeline with respect to return stack speculation resolution that could lead to error messages.
- e300, PPC750, MPC755s, MPC7448s: Improved precision on SDRAM burst handling. Read delay is only applied once for column address strobe. Each subsequent DRAM cycle delivers a data strobe until the corresponding burst has been finished.
TimeWeaver analysis
- Improved handling of external routines.
- Improved handling of trace snippet ends.
Reporting
- Output full context mapping for ValueAnalyzer analyses only in the XML report (if context sensitive info enabled), not the textual reports.
- Only output context sensitive timing analysis results for routines and contexts with non-zero contribution to the textual reports.
DWARF
- Improved reading of DWARFv2 debug information.
- Improved reading of C++ DWARF debug information.
- Improved handling of GHS compiler-generated DWARFv2 debug information.
- Improved handling of source-code information from DWARF debug information.