New Data Flow view
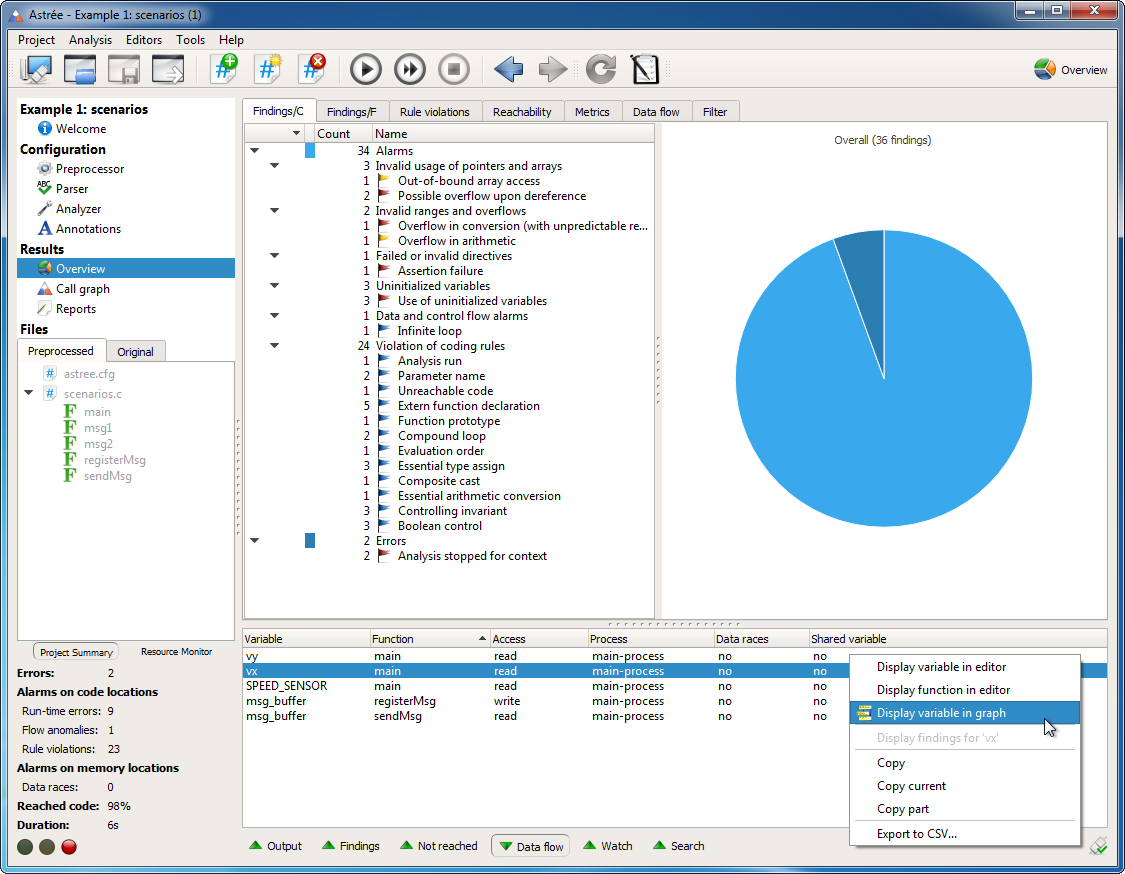
This new view in the Results area lists all data flow information collected by the analyzer. All accesses to global/static variables are shown, with information about whether they are shared or involved in a data race, what kind of access it is, and from which function or process it originates.
The context menu in this view gives access to the corresponding code locations.
You can interactively query the data flow information based on a selection of relevant variables, functions, and processes. These queries are applied as filters to the Data Flow view. This is particularly helpful for identifying all processes and accesses contributing to a data race.
Improved Editor views
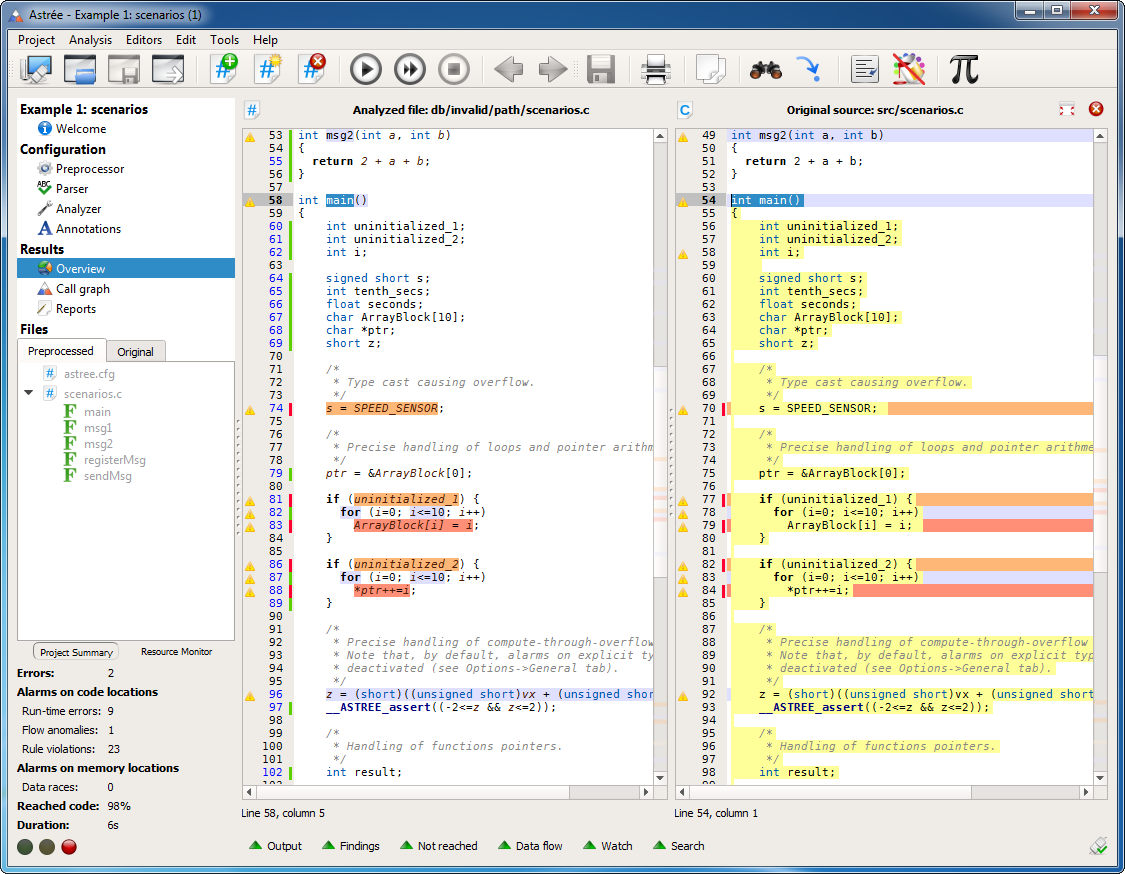
- Analyzed code lines without errors or alarms of type A, B, or C are now marked in green. These lines are proven to be free of runtime errors and data races under the assumptions made by the analyzer.
- Exclamation marks denote code lines for which there are alarms of type A, B, C, D, R, or other notifications. Clicking on an exclamation mark takes you to the corresponding findings in the Findings view.
- The availability of invariants for display in the Watch view is now denoted by blue line numbers rather than a blue bar.
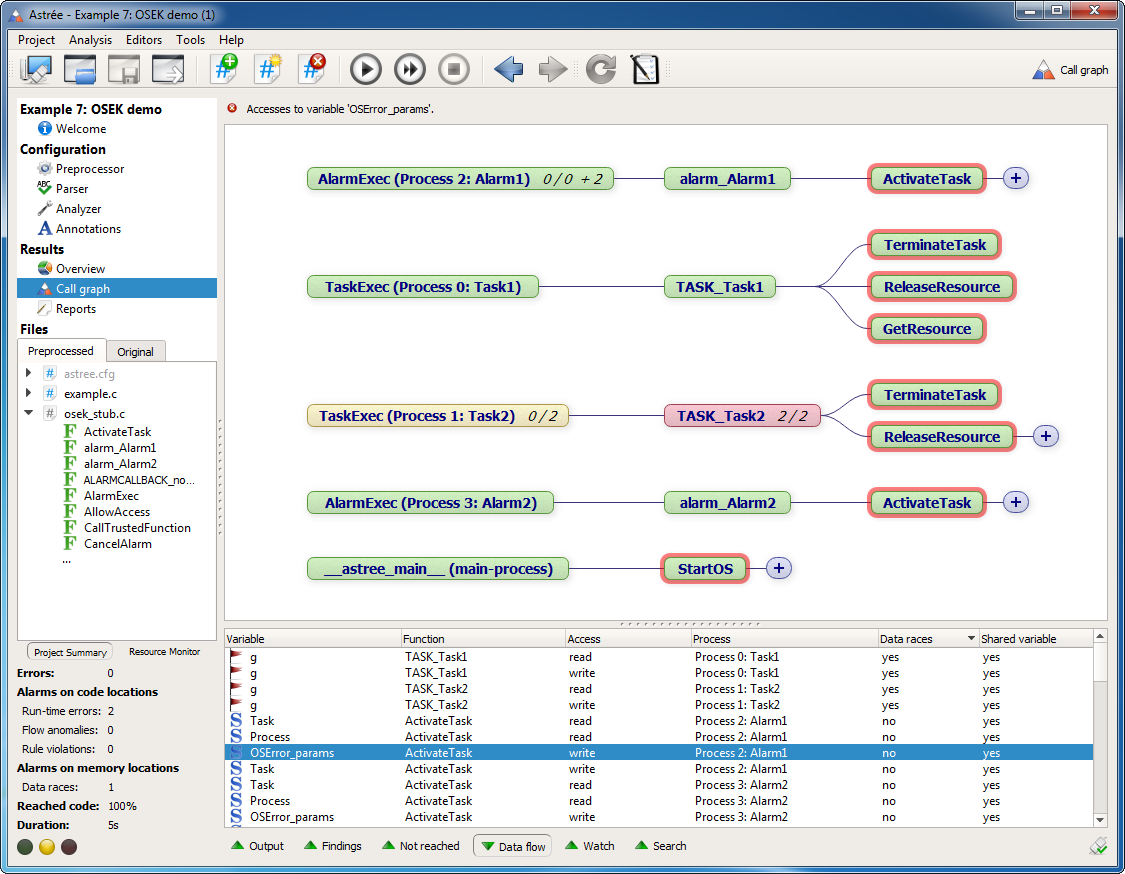
Call paths for accesses to global variables
The Call Graph view can now show all possible call paths for accesses to global variables. This feature is activated in the Data Flow view via the context menu entries “Display in graph” and “Display variable in graph”. It is particularly useful when investigating shared variables and data race alarms.
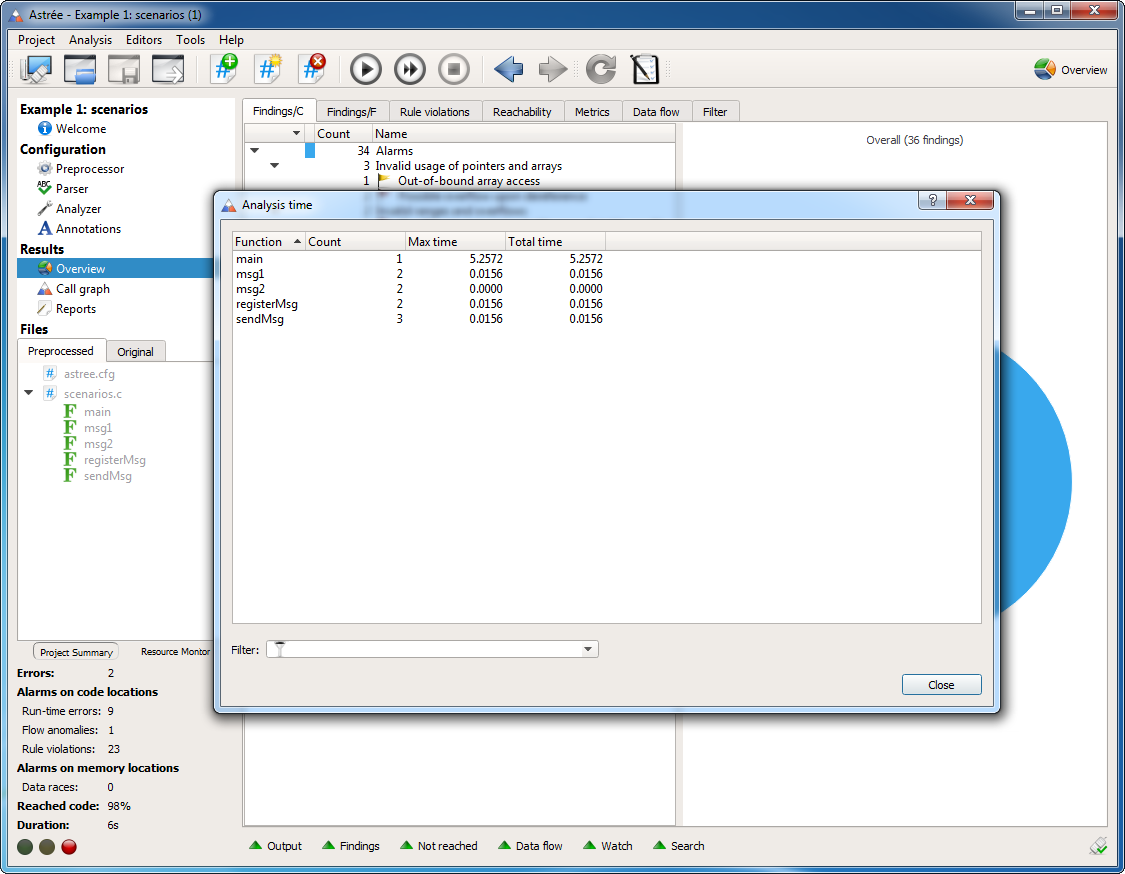
Analysis time
You can now see how much time has been spent analyzing different project parts. This information is available under Tools → Analysis time. It can be accessed as soon as the analysis has started and is updated on-the-fly.
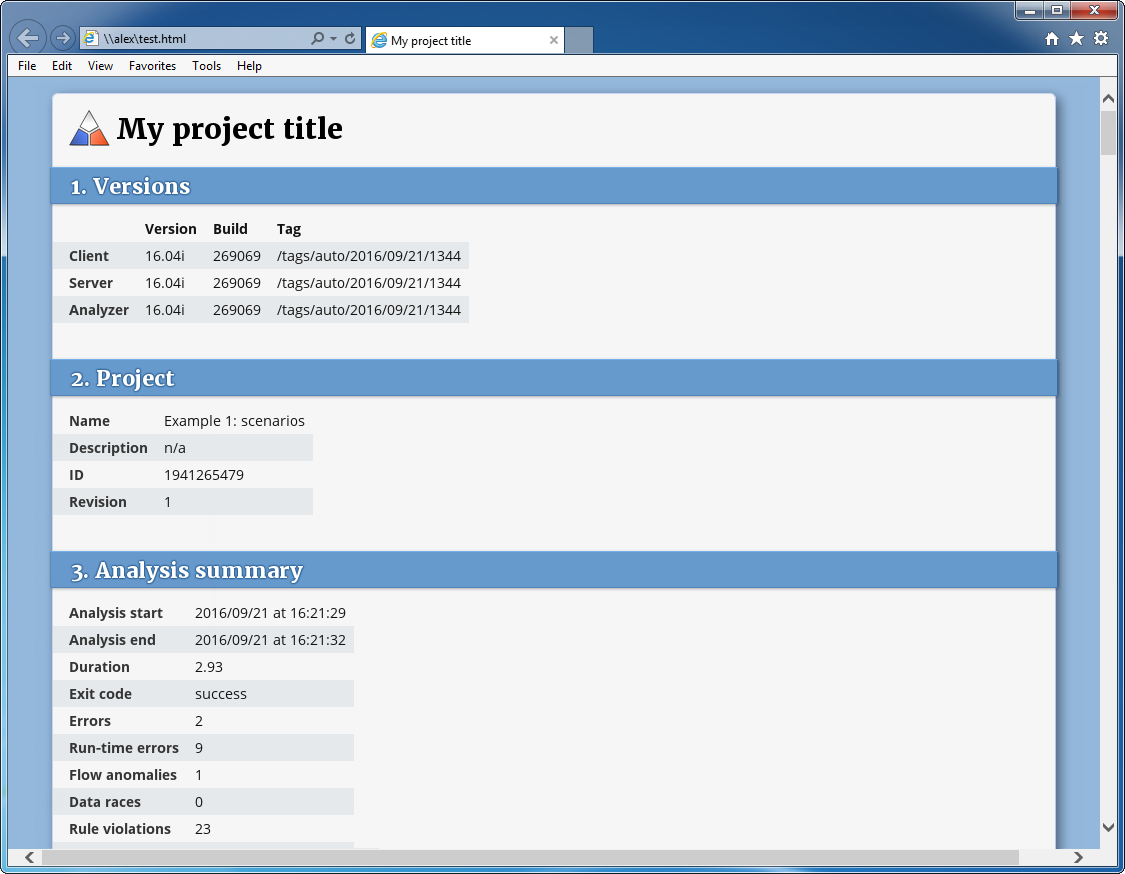
HTML reports
It is now possible to define and generate customized HTML reports. These can be configured in both the GUI and in DAX.
The configuration options provide all reporting features of the XML summary reports, as well as additional options that correspond to the different operating modes of the Overview view in the GUI.
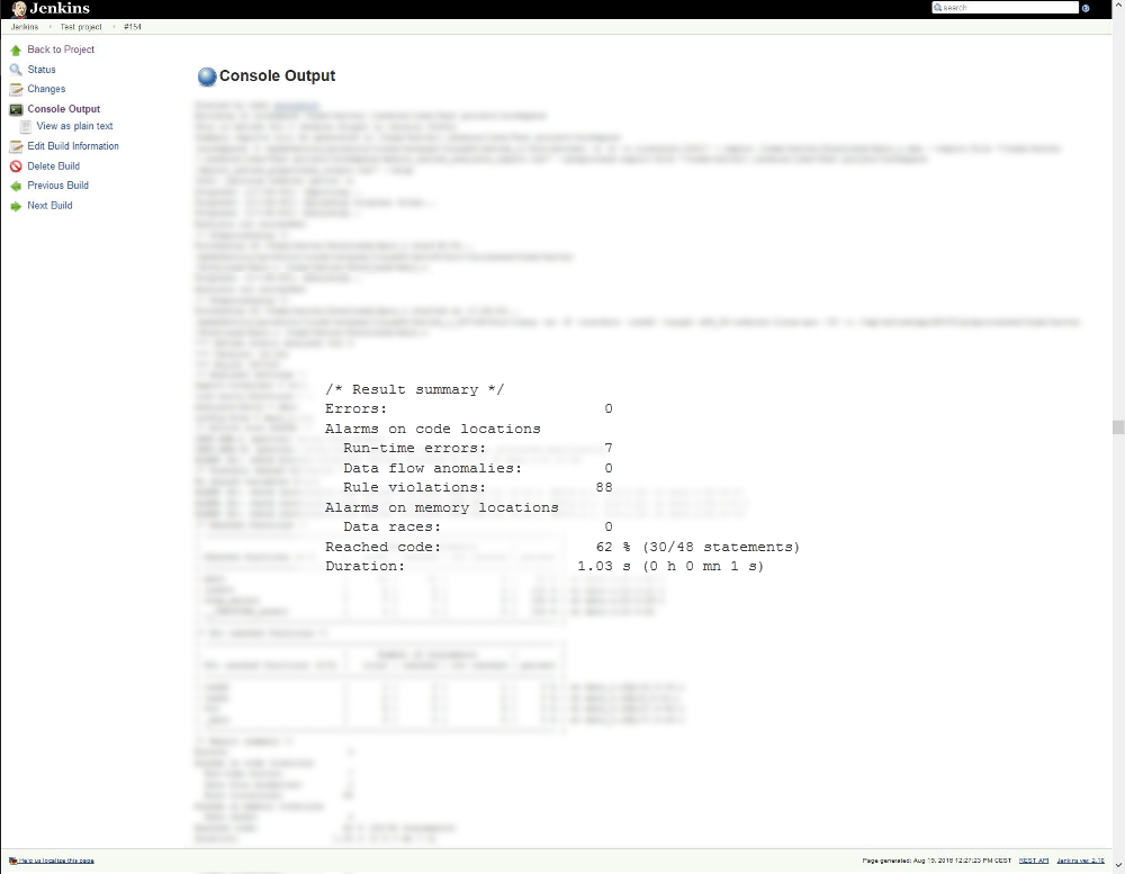
Jenkins plugin
Astrée can now easily be integrated in Jenkins, the leading open-source automation server. Simply download our free plugin from either jenkins-ci.org or GitHub.
The plugin allows you to:
- Automatically check every Jenkins build for runtime errors, data races, and MISRA rule violations
- Archive analysis reports directly in your Jenkins workspace
- Access analysis results via the Jenkins web interface
- Automatically mark a build as erroneous depending on analysis results according to your own criteria
- Launch analyses for different builds as separate analysis revisions for easy debugging and documentation of your progress