aiT takes as input:
- The executable to be analyzed.
- The start address of the task to be analyzed.
- A simple textual description of the memories and buses of your particular microprocessor model (i.e. a list of memory areas with minimum and maximum access times) along with its clock rate.
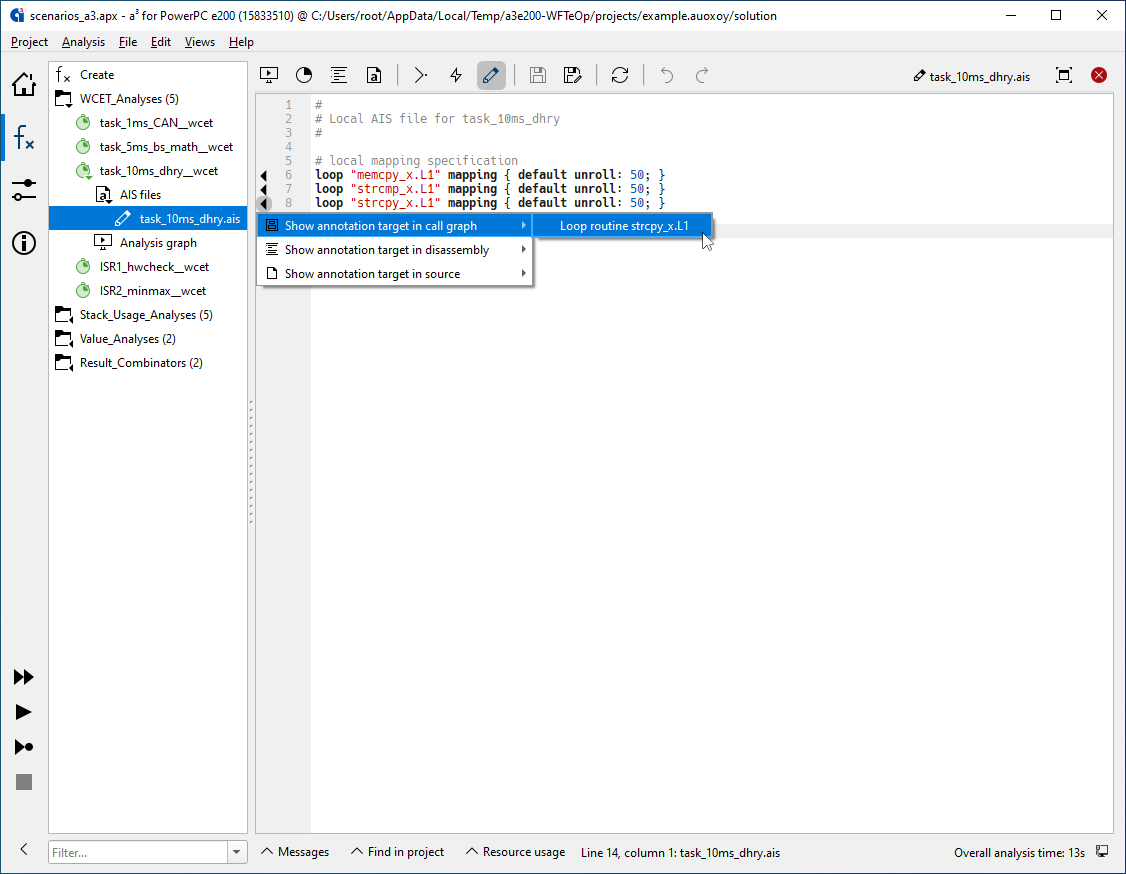
Optional user annotations such as targets of indirect function calls, upper bounds on loop iteration counts, recursion depth, code snippets that should not be analyzed, infeasible code, etc.
Annotations are only required if the information cannot be detected automatically by aiT, e.g. for dynamic program properties. The amount of required annotations is dramatically reduced by advanced techniques such as automatic loop-bound and array-call recognition. It can be reduced further still by running an initalization analysis using the ValueAnalyzer add-on.
“aiT is very easy and straightforward to use. While it does provide a lot of configuration options, one can get to a first WCET computation result very quickly. Advanced configuration through annotations can be added later. [… It also] has by a wide margin the best capabilities to resolve dynamic calls automatically.”
Independent study by University of Stuttgart (PDF)
Annotations for library functions (RT, communication) and RTOS functions can be provided by their respective developers either on source level or in separate files.
aiT outputs:
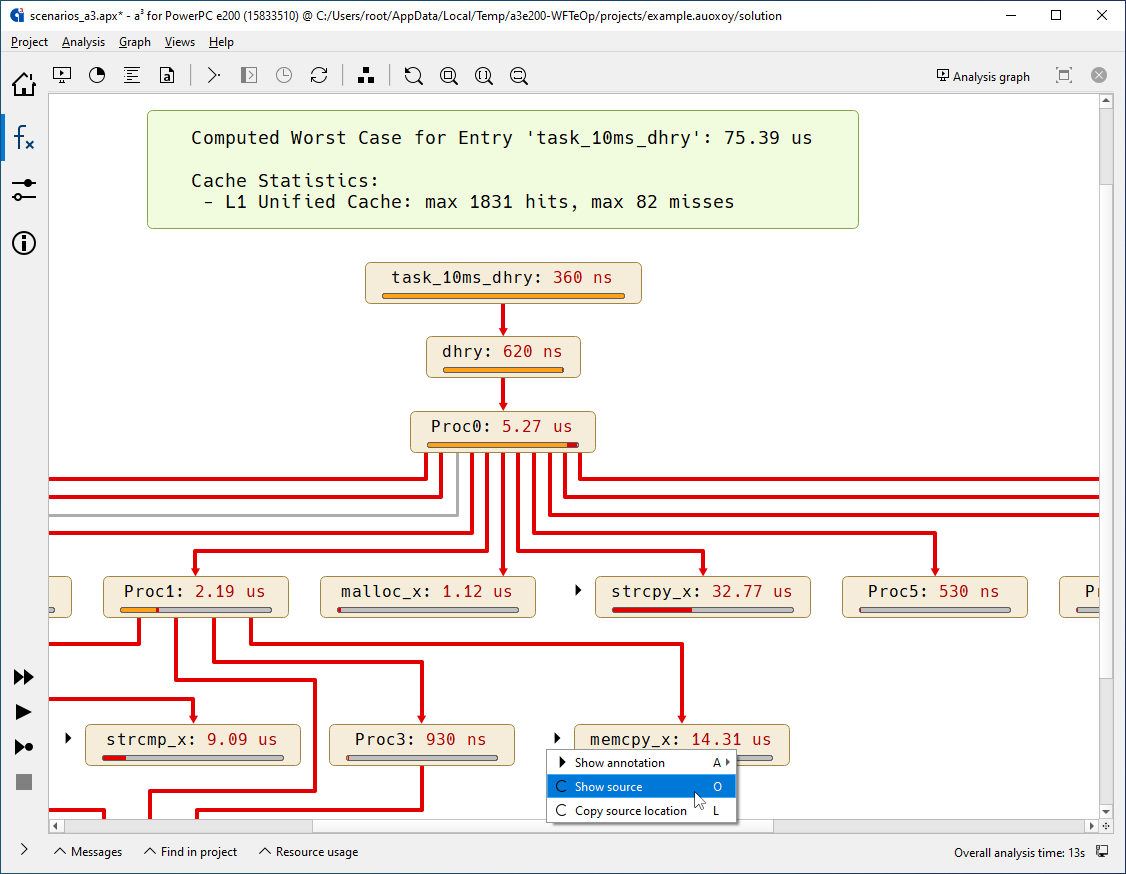
- A tight upper bound of the task’s runtime.
- Visualization of the analysis results providing detailed information about key timing aspects, e.g. the worst-case path or the machine state at any given program point.
- Various statistics, interactive tables, graphs and charts that let you quickly identify bottlenecks and other areas of interest.
- Analysis report files for documentation and certification purposes, as well as for integration with numerous software development tools.
Restrictions
- aiT computes an upper bound of the WCET of a task. A task must be a sequentially executed piece of code, i.e. there must not be any threads, parallelism, or external events. aiT assumes no interference from the outside. Effects of exceptions, interrupts, DRAM refreshes, input/output, timers and other processors or co-processors are not reflected in the predicted runtime and have to be considered separately, e.g. via quantitative analysis.
- The code of the analyzed task must have been generated by the specified compiler from the specified high-level language — normally a restricted subset of ANSI C, less commonly C++, PL/I, or Ada.
- Dynamic data structures are not supported. Functions from
the
allocfamily (such asmallocandcalloc) must not occur in the analyzed code. setjmpandlongjmpstatements must not be used in the analyzed code.- The standard calling conventions described by the embedded application binary interface EABI must be observed. The analysis relies on these calling conventions.
- Return addresses must not be modified.
- The code must not contain any task switches.
Further reading
- Overestimation rates
- Supported processors and compilers
- Integration with SCADE, TargetLink, Jenkins…
- White paper: WCET prediction by static program analysis (PDF, 113kB)
- Review by Airbus France: Computing the WCET of an Avionics Program (PDF, 190kB)
- WCET Tool Challenge 2006 Final Report (PDF, 570kB)

